From the conversion glossary
Concepts referenced in this article, defined.
Concepts referenced in this article, defined.
Run rigorous A/B tests and personalize every visit on Shopify or any storefront — no engineers required.
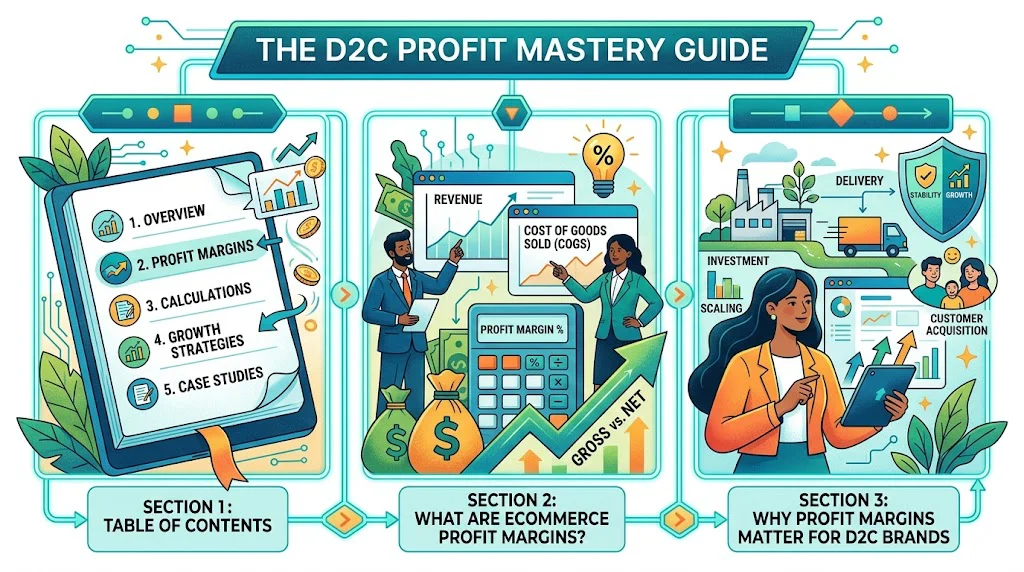
Ecommerce profit margins are the percentage of revenue your D2C brand actually keeps after all costs — and for most brands, these margins are far thinner than revenue growth suggests. A brand doing ₹1 crore in monthly revenue might be retaining only ₹5–10 lakhs after CAC, returns, logistics, and overhead. This guide breaks down exactly how ecommerce profit margins work, what's eating yours, and the specific levers — from AOV optimization to CRO — that profitable D2C brands pull to build sustainable businesses in 2026.
Ecommerce profit margins measure how much of every rupee in revenue your business keeps as profit. They exist at two main levels:
Gross margin: Revenue minus the cost of goods sold (COGS). For a ₹999 skincare product with ₹250 in manufacturing and packaging cost, gross margin is ₹749 (75%).
Net margin: Gross margin minus all other costs — customer acquisition, fulfillment, technology, team, office/warehouse, returns, and payment processing. This is your real profitability number.
The gap between gross and net margin is where most D2C brands run into trouble. Healthy gross margins (40–70% for most consumer products) can coexist with net margins of 2–5% or even negative numbers when CAC and fulfillment costs spiral.
For a D2C brand to be genuinely profitable — not just growing — the focus must shift from top-line revenue to contribution margin per order and cohort-level LTV:CAC ratios.
The 2020–2022 period of cheap capital allowed many D2C brands to grow revenues while burning cash — acquiring customers at CACs that exceeded first-purchase gross margins, in the hope that repeat purchases would make the economics work. As capital became more expensive in 2023–2025, the brands that hadn't built genuine unit economics didn't survive.
The lesson: revenue without margin is not a business — it's a fundraising story.
Indian D2C brands face several unique margin pressures:
Consider two D2C brands:
| Metric | Brand A | Brand B |
|---|---|---|
| Monthly revenue | ₹50 lakhs | ₹50 lakhs |
| Gross margin | 60% | 60% |
| CAC | ₹600 | ₹300 |
| AOV | ₹900 | ₹900 |
| Net margin | 3% | 18% |
| Monthly profit | ₹1.5 lakhs | ₹9 lakhs |
Brand B, with half the CAC and the same revenue, generates 6x the profit. CAC reduction — achievable through CRO, better targeting, and improving organic traffic — is the single most powerful margin lever for most D2C brands.
For each order, your actual profitability looks like this:
Revenue per order (AOV)
- Cost of goods sold (COGS): manufacturing + packaging
= Gross profit per order

- Fulfillment cost: picking, packing, shipping
- Payment processing fee: 1.5–2.5% of revenue
- Return & replacement cost: blended across all orders
- Attributed CAC: ad spend ÷ orders from that campaign
= Contribution margin per order (what's left)

- Fixed costs (technology, team, warehousing) divided by total orders
= Net profit per order
For most D2C brands, the contribution margin per order (before fixed costs) is the most actionable metric — it tells you whether you're making money on each additional order, separate from your overhead base.
Take your last 30 days:
After fixed costs (technology, team, warehouse), net margin might be 10–20% of that, depending on your overhead base.
There are four ways to improve ecommerce profit margins:
CRO affects levers 1, 2, and indirectly 4 (better product descriptions reduce "not as described" returns).
Revenue minus COGS. The most commonly discussed margin metric. For D2C brands:
Gross margin is where product strategy matters — premium brands with strong brand equity can price at 3–5x COGS, while commodity products compete on thin margins.
Gross margin minus variable costs (fulfillment, marketing, payment processing, returns). This is the most operationally useful metric for D2C brands — it tells you the margin on each incremental order.
Healthy contribution margins for D2C: 25–40%. Below 15% is a warning sign. Negative contribution margin (you lose money on each order) is only sustainable with a very specific and validated long-term LTV thesis.
Contribution margin minus fixed costs. For D2C brands at scale (₹5 crore+ monthly revenue), healthy net margins are 10–20%. Early-stage brands often operate at 0–5% net margin while investing in growth.
The most sophisticated margin view: accounting for the present value of future purchases from a customer cohort. A customer acquired at ₹600 CAC who makes 4 purchases at ₹900 AOV over 18 months generates much better economics than a customer acquired at ₹300 CAC who buys once.
LTV-adjusted margin analysis changes prioritization: acquiring customers in categories with high repeat rates (supplements, pet food, personal care) is more valuable than acquiring one-time buyers, even at higher CAC.
Not all products have equal margins. Running SKU-level contribution margin analysis often reveals that 20% of your products generate 80% of your profit, while some products are actually margin-negative after returns and fulfillment.
This analysis should drive your CRO priorities: test more aggressively on your high-margin SKUs, and consider whether it makes strategic sense to keep promoting your lowest-margin products.
Before increasing your marketing budget, calculate your contribution margin per order. If it's negative or near-zero, scaling will make you lose money faster. Fix the unit economics first, then scale.
Conversion rate optimization is your most powerful CAC reduction tool. If your Shopify store converts at 2% and you spend ₹10,00,000/month on ads for 10,000 visitors, you're paying ₹500 per purchase. If CRO improves your conversion rate to 3%, the same spend now generates 15,000 visits' worth of conversion — your effective CAC drops to ₹333 without changing your ad budget.
An 11% CVR improvement (the average for CustomFit.ai customers) reduces CAC by approximately 10% — equivalent to getting 10% more margin on every paid acquisition.
Average order value improvement is a direct margin improvement because most variable costs (fulfillment, payment processing) are relatively fixed per order regardless of order size. Tactics that work for D2C:
In India, COD orders that are returned are a significant margin drain. Strategies to reduce COD return rates:
Pull a report of contribution margin by SKU. You will likely find significant variation. Use this to:
If your highest-margin product has a lower-than-average conversion rate on its product page, CRO on that specific page has disproportionate margin impact. Use CustomFit.ai to run A/B tests on your top-margin product pages first.
Blanket discount codes (e.g., "FLAT20" for 20% off sitewide) are direct margin erasers and attract bargain-hunters with low LTV. Replace them with:
SEO-driven organic traffic has near-zero marginal CAC once the content investment is made. Brands that build content SEO programs consistently see their blended CAC decline over 12–18 months as the organic share of new customer acquisition grows. A 30% organic acquisition mix significantly improves blended net margins.
Don't just look at aggregate margins. Track contribution margin by acquisition month cohort. Are customers acquired in Month 1 of your business more profitable over 12 months than those acquired in Month 12? Understanding cohort economics helps you see the long-term impact of your channel and offer strategy.
Every A/B test and promotion should have a margin floor: the minimum acceptable contribution margin per order. If a test variant improves CVR but reduces AOV enough to drop contribution margin below the floor, it fails — regardless of the conversion rate improvement.
| Tool | Best For | Key Feature | Starting Price |
|---|---|---|---|
| CustomFit.ai | CRO + AOV optimization | A/B testing, upsell testing, D2C-native metrics (AOV, RPV) | $99/mo |
| Triple Whale | D2C profitability analytics | Blended CAC, contribution margin, cohort LTV | $129/mo |
| Glew | Ecommerce analytics | SKU-level profitability, channel attribution | $79/mo |
| Loop Returns | Returns management (reduces return rate) | Shopify-native returns, exchange incentives | $59/mo |
| ReConvert | Post-purchase upsells | AOV optimization via thank-you page offers | $4.99/mo |
Why CustomFit.ai for margin optimization: CustomFit.ai surfaces AOV and revenue per visitor (RPV) as first-class metrics alongside conversion rate — unlike VWO and Optimizely, which default to generic conversion rate metrics. For margin optimization, knowing that a test variant improved CVR by 5% but reduced AOV by 12% (bad for margins) is critical — and CustomFit.ai shows you both.
Chargebee (B2B SaaS) increased average deal value by 40% through plan page personalization that showed returning pricing-page visitors a targeted "most popular" plan with a time-sensitive offer. The methodology applies directly to D2C ecommerce: showing returning cart abandoners a bundle offer instead of a discount can achieve similar AOV and margin improvements.
Bellavita, an Indian D2C fragrance brand, introduced curated gift sets at ₹1,499 and ₹2,499 — bundles of 3–4 products with 15% bundle discount vs. individual prices. The bundles improved AOV from ₹650 to ₹1,100 for bundle-buyers. Because manufacturing cost per unit doesn't scale linearly, gross margin per bundle order was higher in absolute rupees than two individual orders. The bundle strategy, combined with a 11% CVR improvement, significantly improved overall unit economics.
Kapiva identified that their COD return rate was 28% vs. 8% for prepaid orders. They implemented a two-step approach: a post-order COD confirmation SMS asking customers to confirm the order, and a ₹50 discount incentive to switch to prepaid at checkout.
COD return rate dropped from 28% to 19% over 60 days. At ₹120 average reverse logistics cost per return, this represented ₹10,800 saved per 1,000 COD orders — directly improving contribution margin and contributing to a 9.48% improvement in effective conversion rate (factoring in completed vs. returned orders).
Wow Skin Science A/B tested their free shipping threshold across three variants: no threshold (standard shipping cost shown), ₹599 threshold, and ₹799 threshold. The ₹599 threshold (just above their then-AOV of ₹520) produced the best results — a 23% increase in AOV with minimal conversion rate decline. This single test improved contribution margin per order by an estimated 8% by both raising revenue per order and increasing the absolute margin for orders above the threshold.
Sugar Cosmetics analyzed SKU-level contribution margins and found that their lip products had 68% gross margins vs. 41% for their foundation range. They shifted their promotional calendar to feature lip products during festive seasons and face products during everyday use promotions. By directing traffic to higher-margin products through targeted campaigns, they improved overall blended contribution margin without changing pricing.
Many D2C founders track monthly revenue religiously while margin data sits in a spreadsheet updated quarterly. Decisions made without real-time margin visibility consistently produce revenue growth at the cost of profitability.
Customers acquired via different channels, at different price points, and in different product categories have dramatically different LTVs. Treating all customers as equal when making CAC or promotion decisions leads to over-investment in acquiring your lowest-value customer segments.
Discounts are the most margin-destructive conversion tool. Every 10% discount directly reduces gross margin by 10 percentage points. Brands that have built conversion models around discounting find it nearly impossible to return to full-price selling — customers have been trained to wait. Break this cycle early.
Payment gateway fees vary by payment method (UPI vs. COD vs. credit card). Most brands don't account for this at the SKU or channel level. If UPI has a 1% fee and credit cards have a 2.5% fee, and 40% of your orders are on credit cards, that's a meaningful margin difference that should inform your payment optimization strategy.
Many D2C brands calculate margins before returns. Post-return margins are often 5–10 percentage points lower. Always build returns cost into your unit economics model, and track it monthly.
Increasing ad spend before achieving positive contribution margin is the most common D2C profitability mistake. The path to profitability through scale rarely works in practice — economies of scale in ecommerce are limited, and CAC tends to increase as you exhaust your most efficient audiences.
New customer acquisition costs 5–7x more than retaining existing customers. Brands that over-index on acquisition spending at the expense of retention, loyalty programs, and post-purchase email flows consistently have worse unit economics than brands that balance acquisition and retention.
Don't wait for monthly financial reports to understand your margins. Build a dashboard (using Triple Whale, Glew, or a custom setup) that shows daily contribution margin per order, blended CAC by channel, and AOV by traffic source. Decisions made with daily visibility outperform decisions made with monthly hindsight.
Build a simple model showing how your net margin changes with a 10%, 20%, and 30% change in CAC and AOV independently. This quantifies the value of CRO investments (which reduce CAC and improve AOV) in margin terms, making it easy to justify the investment in tools like CustomFit.ai.
Most D2C brands undervalue their premium products. If your ₹999 product has a contribution margin of ₹450, testing a price of ₹1,199 with a 15% conversion rate decline still produces higher total margin per 100 visitors. Use A/B testing to find the revenue-maximizing price point for your top-margin SKUs.
Instead of just offering a discount at checkout to switch from COD to prepaid, build a multi-touch funnel: a confirmation SMS immediately post-order, a follow-up SMS 2 hours later with a prepaid switch offer, and an email 24 hours later for email-captured customers. Each touchpoint that successfully converts a COD order to prepaid saves ₹80–₹150 in potential return costs.
Survey customers after purchase: "How did you hear about us?" and "What was your primary reason for buying?" The answers will reveal which channels and messaging attract your highest-LTV customers — and let you shift acquisition spend accordingly. Often, the highest-LTV customers came from channels with the highest apparent CAC (influencer marketing, SEO content), while low-CAC discount-driven channels produce the lowest-LTV customers.
What is a good profit margin for an ecommerce business? A healthy ecommerce net profit margin is 10–20% for D2C brands. Gross margins typically run 40–60% for physical products. D2C brands in India often operate with 15–25% gross margins after logistics and COD return costs, though premium beauty and wellness brands can reach 50–65%.
What eats into D2C ecommerce profit margins the most? The four biggest margin killers are: customer acquisition cost (CAC), return rates (especially COD returns in India), fulfillment costs, and customer discounting. COD returns in India alone can reduce effective gross margins by 8–15%.
How does CRO improve ecommerce profit margins? CRO improves margins by increasing revenue generated per rupee of ad spend (lowering effective CAC) and by enabling AOV-lifting strategies like upsells and bundles. A 1% improvement in conversion rate with flat ad spend dramatically improves blended CAC and margin.
What is the difference between gross margin and net margin in ecommerce? Gross margin is revenue minus COGS. Net margin is gross margin minus all other costs — CAC, fulfillment, technology, team, and overhead. Net margin is true profitability. Many D2C brands have healthy gross margins but thin net margins due to high CAC.
How can AOV improvement help ecommerce margins? Most variable costs per order are fixed regardless of order size. A ₹500 order and a ₹900 order cost nearly the same to fulfill. AOV improvements through bundling, upsells, and free-shipping thresholds produce nearly linear margin improvements.
What is a good CAC:LTV ratio for D2C ecommerce? A healthy CAC:LTV ratio is at least 1:3. Your customer lifetime value should be at least 3x your CAC. Profitable D2C brands target 1:3 or better, achieved through repeat purchase optimization and margin management.
Does reducing discounts hurt D2C conversion rates? Not necessarily. Discounts improve short-term CVR but train customers to wait for offers, attract low-LTV buyers, and erode margins. Brands that replace blanket discounts with value-based incentives often maintain or improve conversion rates with significantly better margins. Test with A/B tests.
What Shopify tools help optimize ecommerce profit margins? CustomFit.ai for CRO and AOV optimization. Triple Whale or Glew for profitability analytics. Loop Returns to manage return rates. ReConvert for post-purchase upsells. Together these provide full margin visibility and the levers to improve it.
Start your free trial of CustomFit.ai — 14 days, no credit card required. Setup in under 30 minutes.