From the conversion glossary
Concepts referenced in this article, defined.
Concepts referenced in this article, defined.
Run rigorous A/B tests and personalize every visit on Shopify or any storefront — no engineers required.
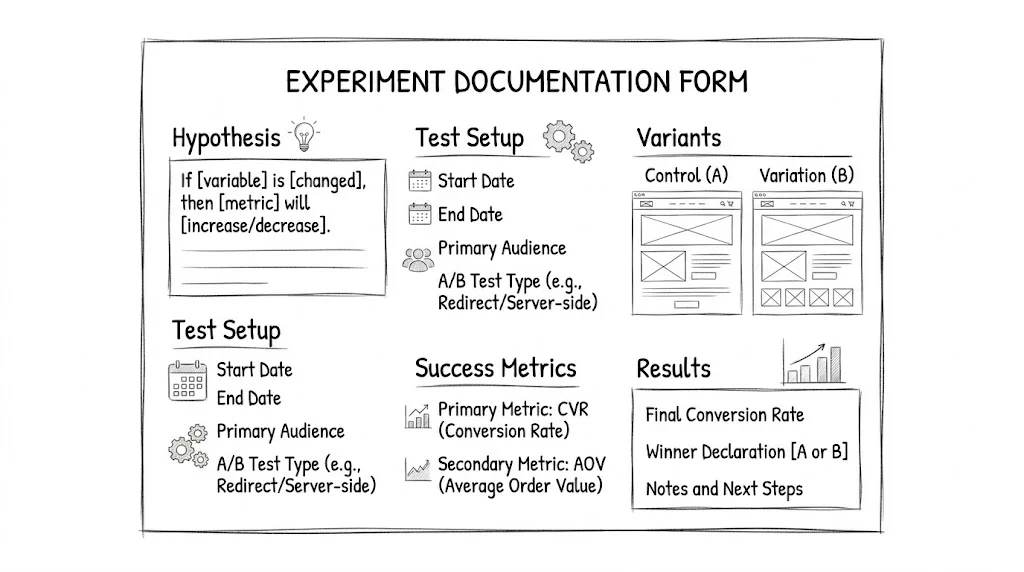
A/B testing without documentation is an activity. A/B testing with documentation is a program. Documentation captures why you ran each test, what you expected, what actually happened, and what you learned — building institutional knowledge that compounds over time. This free template covers everything your team needs to document before, during, and after every test. Copy and use it.
Most D2C teams run A/B tests without proper documentation. The result: they re-test the same ideas years later (because no one remembers the results), they can't explain to new team members why the site looks the way it does, and they can't build on previous learnings because those learnings were never captured.
Teams with good documentation do the opposite. They know exactly which elements on their site have been tested, what the results were, and what hypotheses remain to be tested. New team members onboard faster. Investors can see a rigorous experimentation process. The testing program becomes a strategic asset, not just a set of experiments.
Below is the full template. Copy this into Notion, Google Docs, or Airtable for each test.
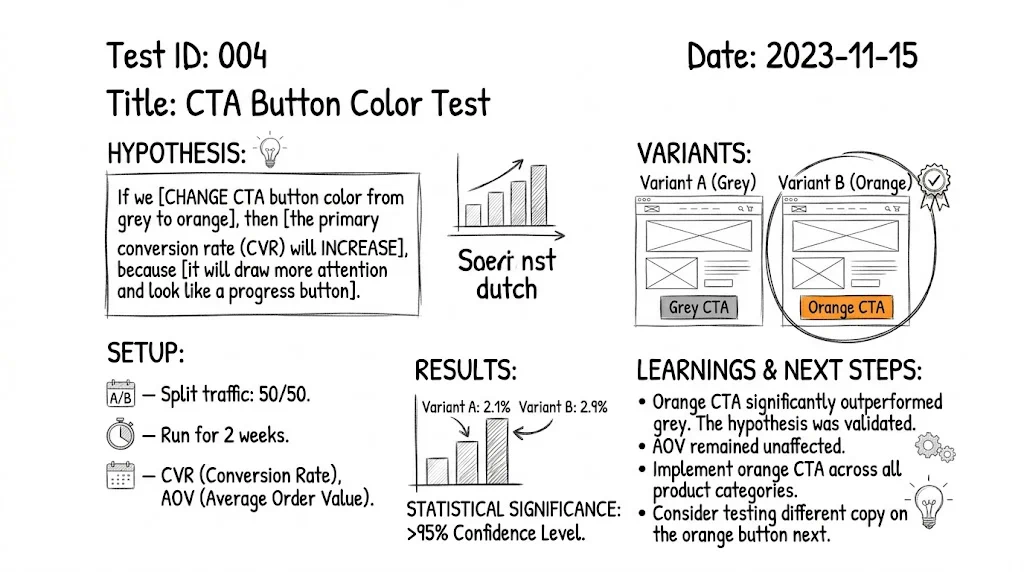
Test Name: [Descriptive name, e.g., "Homepage Hero — Value Prop vs Social Proof Focus"]
Test ID: [ID from testing tool]
Created by: [Name]
Creation date: [Date]
Status: Planning / Running / Completed / Abandoned
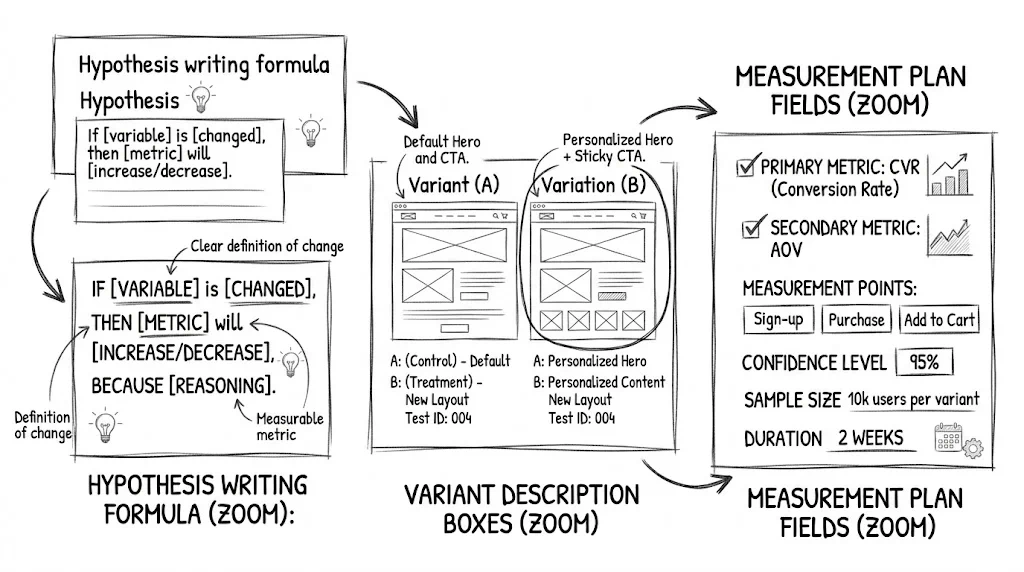
The most important part of any test document. A good hypothesis has three components: observation, proposed change, and expected outcome.
Observation:
[What did you see in your data, session recordings, or customer feedback
that suggests this change is worth testing?]

Example: "Heatmap data shows 78% of mobile visitors never scroll past the
hero section on the homepage. The current hero focuses on product imagery
with no explicit value proposition. Customer interviews indicate that
new visitors don't understand what differentiates us from competitors."

Proposed Change:
[What specifically will you change in the variant?]

Example: "Replace the current product-image-focused hero with a headline
stating our core value proposition ('India's fastest-delivered skincare,
with a 30-day returns guarantee'), with one product image and a prominent CTA."

Expected Outcome:
[What metric do you expect to improve, by approximately how much, and why?]

Example: "We expect the variant to improve homepage-to-product-page
click-through rate by 15–20%, because communicating the value proposition
clearly reduces the information gap that causes visitors to bounce without
engaging further."
Test Type: A/B / Multivariate / Personalization

Pages in scope:
- [List every URL or page template included in the test]

Traffic allocation:
- Control: [X]%
- Variant A: [Y]%
- Variant B (if multivariate): [Z]%

Target audience:
- All visitors / New visitors only / Returning visitors only /
  Mobile only / [Custom segment definition]

Testing tool: [CustomFit.ai / VWO / etc.]
Test ID in tool: [ID]

Launch date: [Date]
Planned end date: [Date]
Maximum duration: [e.g., 30 days]

Sample size target: [Required visitors per variant for significance]
Statistical significance target: [95% / 90% confidence]
Variant description:
[Clear written description of every change made in each variant.
Be specific enough that someone could recreate the variant from the description alone.]

Variant A changes:
1. [Change 1 — element, change made, reason]
2. [Change 2]
3. [Change 3]

What STAYS THE SAME:
[List elements that are intentionally kept identical between control and variant.
This is important for isolating the effect of the changes.]
Primary metric (decision metric):
[One metric that determines whether the variant wins or loses]
Example: "Purchase completion rate (orders / sessions)"

Secondary metrics (diagnostic):
[2–4 additional metrics you'll track to understand how the primary
metric changed and why]
Example:
- Homepage to product page click-through rate
- Add-to-cart rate
- Revenue per session

Guardrail metrics:
[Metrics you're monitoring to ensure the variant doesn't cause harm
in other areas]
Example:
- Return rate (we don't want a misleading variant to increase returns)
- Customer support contact rate (we don't want confused customers)
- Page load time (we don't want the variant to slow the page significantly)

Baseline (pre-test) values:
- Primary metric baseline: [X%] (measured over [date range])
- Secondary metric 1 baseline: [Y%]
- Secondary metric 2 baseline: [Z%]
[ ] Desktop render verified (Chrome)
[ ] Mobile render verified (iPhone)
[ ] Mobile render verified (Android)
[ ] Conversion tracking fires correctly
[ ] Traffic split verified (both variants receiving visitors)
[ ] Anti-flicker functioning (no visible flicker on throttled connection)
[ ] No JavaScript console errors
[ ] Checkout flow complete walkthrough done
[ ] Form submissions functional
[ ] Page speed impact checked (baseline vs. test)

QA completed by: [Name]
QA date: [Date]
QA notes: [Any issues found and resolved]
(Complete after test ends)
Test end date: [Date]
Reason for ending: [Reached significance / Reached max duration / Abandoned]

Final sample sizes:
- Control: [N visitors]
- Variant A: [N visitors]
- Variant B (if applicable): [N visitors]

Primary metric results:
- Control: [X%]
- Variant A: [Y%]
- Absolute difference: [+/-Z percentage points]
- Relative difference: [+/-W%]
- Statistical significance: [X% confidence]
- Result: Control wins / Variant A wins / Inconclusive

Secondary metrics:
- [Metric 1]: Control [X%] vs Variant [Y%] — [direction]
- [Metric 2]: Control [X%] vs Variant [Y%] — [direction]

Revenue impact estimate:
- Estimated incremental revenue from winner (if implemented):
  [CVR improvement] × [monthly sessions] × [average order value] = [₹X/month]
Device type results:
- Mobile: Control [X%] vs Variant [Y%] — [Win/Loss/Neutral]
- Desktop: Control [X%] vs Variant [Y%] — [Win/Loss/Neutral]

Traffic source results:
- Paid traffic: Control [X%] vs Variant [Y%]
- Organic: Control [X%] vs Variant [Y%]
- Direct: Control [X%] vs Variant [Y%]

New vs returning visitor results:
- New visitors: Control [X%] vs Variant [Y%]
- Returning visitors: Control [X%] vs Variant [Y%]

Key segment finding:
[1–2 sentences summarizing the most important segment insight]
Decision: Implement winner / Stay on control / Run follow-up test / Needs more data

If implementing:
- Implementation date: [Date]
- Implementation method: [CustomFit.ai rollout / Developer implementation]
- Implemented by: [Name]

If not implementing:
- Reason: [Why the winner wasn't implemented despite statistical significance]
What we learned:
[2–4 bullet points of genuine insight from this test —
applicable beyond just this specific test]

Example:
• Adding specific delivery promise ("arrives by [date]") outperforms
  generic "fast shipping" messaging for mobile visitors — suggests
  specificity matters more for mobile where context is limited.
• Trust signals work differently for paid vs organic traffic — paid
  traffic needs more reassurance before converting.

What we'd do differently:
[Honest reflection on test design, setup, or analysis that could be improved]

Follow-up tests generated:
1. [Hypothesis for test inspired by this result]
2. [Hypothesis]

Test ID linked to this result: [If a follow-up test has already been created]
Notion: Best for teams that want rich documentation with linked databases. Create a master "Experiments" database where each record is one test, with all 10 sections as properties or sub-pages.
Airtable: Best for teams that want spreadsheet-style filtering and reporting alongside rich documentation. The grid view lets you filter tests by status, page, primary metric, or result.
Google Sheets: Simplest starting point. A single spreadsheet with one row per test and key columns covers the essentials. Not great for rich text fields but works for smaller teams.
Confluence: Common in larger organizations with existing Atlassian tooling. Good integration with Jira for test backlog management.
The right tool is whichever one your team will actually use consistently. Start with Google Sheets if you're unsure — you can migrate to a richer tool as your documentation practice matures.
Write the hypothesis before setting up the test. The temptation is to set up the test in your testing tool first, then write documentation later. Reverse this order. Writing the hypothesis forces clarity about what you're testing and why, which often reveals test design issues before you waste time on a poorly-specified experiment.
Document null results as thoroughly as winners. A test that shows no significant difference between control and variant is still valuable — it tells you the change didn't matter, which is itself a finding. "We tested X, it didn't work, here's what we learned" is exactly the institutional knowledge that prevents repeated effort.
Review test documentation in retrospective. Monthly or quarterly, review recent completed tests as a team. Look for patterns: do tests on mobile consistently outperform desktop? Do tests on paid traffic pages behave differently from organic pages? These patterns generate new hypotheses.
Link related tests. When test B was inspired by learning from test A, link them in your documentation. This creates a searchable chain of reasoning that helps new team members understand the experimentation history.