CustomFit.ai โ€” Website personalization, A/B testing and CRO for Shopify and D2C
Product
Features
โœฑ
Website Personalization
Adapt to each visitor's behavior & intent
โง–
A/B & Multivariate Testing
Rigorous experimentation
โœจ
AI CopilotNEW
Personalize with a prompt
๐Ÿค–
AI WingmanNEW
Auto-optimize toward winners
๐ŸŽฏ
AI Conversion OptimizerNEW
GPT-grade test ideas
โœŽ
No-Code Visual Editor
Drag-and-drop edit any element
โ–ฆ
Product Recommendations
Personalized recs that lift AOV
โš‘
Feature Flags
Ship safely with kill-switches
โ—ง
Chrome Extension
Edit your store in the browser
โง‰
Shopify, WooCommerce & more
All platform integrations
View all features โ†’
Use Cases
$
Price A/B Testing
Test price points to maximize revenue
โ–ฆ
Theme A/B Testing
Compare whole layouts & designs
๐Ÿ—‚
Template A/B Testing
Test whole PDP/PLP templates
๐Ÿท
Discount A/B Testing
Find the offer that converts
๐Ÿšš
Shipping A/B Testing
Thresholds, speed & copy
โœ
Content A/B Testing
Copy, images & reviews
๐Ÿ’ณ
Checkout Gateway A/B
Payments & one-click
โŒ–
Geo-Based Personalization
Per-location content & offers
โšก
Buyer-Intent Nudges
Exit-intent & retargeting
โ†”
Split-URL / Redirection
Full-page redirect tests
View all use cases โ†’
Solutions & Guides
โคข
Conversion Rate Optimization
The complete CRO guide
โง–
A/B Testing Software
Buyer's guide for D2C
๐Ÿ›’
Cart Abandonment Recovery
Win back lost carts
๐Ÿ“ฐ
Landing Page Optimization
Convert more paid traffic
S
Shopify A/B Testing
Test your store, no code
S
Shopify Personalization
Tailor the store per shopper
โ—”
First-Time Visitor Offers
Convert new shoppers with trust & offers
โ˜…
Repeat-Customer Experiences
Reward and re-engage loyal buyers
โ—Ž
Campaign-Matched Pages
Match the landing page to the ad
โŒ–
Location-Based Experiences
Currency, language & regional offers
Explore CRO โ†’
Customer stories
GIVA
+32%
conversion via personalized recs
GIVA
Mamaearth
+18%
revenue lift from PDP A/B tests
ME
The Sleep Company
+24%
AOV from product recommendations
TSC
Read customer stories โ†’
Integrations
SWsfGA+15
โœฆ
Not sure where to start?
Let AI Copilot pick your first tests

โ€œWe wake up to evidence-backed tests ready to deploy โ€” not a backlog of maybe ideas.โ€

AN
Anirudh S.
Growth ยท Chargebee
โ˜…โ˜…โ˜…โ˜…โ˜…4.8on G2 ยท 2,400+ brands
Talk to our team โ†’
Widgets
Integrations
Ecommerce & Checkout
Shopify
Shopline
Shoplazza
GoKwik
ShopFlo
Razorpay Magic Checkout
Breeze
Shiprocket
View all integrations โ†’
Analytics & Behavior
Google Analytics 4
Microsoft Clarity
Hotjar
Mixpanel
Amplitude
Heap
Adobe Analytics
Segment (CDP)
View all integrations โ†’
Engagement, CRM & More
Klaviyo
MoEngage
CleverTap
WebEngage
HubSpot
Salesforce
Slack
Meta Ads
View all integrations โ†’
CustomersPricing
Resources
CRO
โ–ค
Playbooks
Proven strategies to boost conversions
๐ŸŽ™
Interviews
D2C leaders & marketing experts
โ–ถ
Webinars
Live deep dives & product sessions
Learn
โœŽ
Blog
Tips, experiments & best practices
๐Ÿ“•
Free E-Books
Mastering personalization
๐Ÿ“–
Conversion Glossary
Every CRO term, defined
โœฆAI CopilotNEWLog inBook a demo
Start free trial
Select your platform โ€” Install in 2 minsWe'll tailor the setup
โšก Risk-free 14-day trial ยท No credit card ยท Cancel anytime
S
Shopify
Install from Shopify App Store
โ€บ
W
WooCommerce
Install the WooCommerce plugin
โ€บ
B
BigCommerce
Install from BigCommerce App Marketplace
โ€บ
SL
Shopline
Install from Shopline App Store
โ€บ
M
Salesforce / Magento
Install from the marketplace
โ€บ
SZ
Shoplazza
Install from Shoplazza App Store
โ€บ
WP
WordPress / Webflow
Install plugin or paste the script
โ€บ
โ—ง
Others
Custom-built on React, Next.js, etc.
โ€บ
Tip: pick your platform โ€” we handle the restBook a demo โ†’
Product
Website PersonalizationA/B & Multivariate TestingAI CopilotAI WingmanAI Conversion OptimizerNo-Code Visual EditorProduct RecommendationsFeature FlagsView all features โ†’
Use Cases
Price A/B TestingTheme A/B TestingTemplate A/B TestingDiscount A/B TestingShipping A/B TestingContent A/B TestingCheckout Gateway A/BGeo-Based PersonalizationBuyer-Intent NudgesSplit-URL / Redirection
Solutions & Guides
Conversion Rate OptimizationA/B Testing SoftwareCart Abandonment RecoveryLanding Page OptimizationShopify A/B TestingShopify Personalization
Explore
WidgetsIntegrationsCustomersPricing
Resources
BlogPlaybooksWebinarsInterviewsE-BooksConversion Glossary
Platforms
ShopifyShoplineShoplazzaChrome ExtensionAll integrations
Start free trialBook a demo
Homeโ€บBlogโ€บab testingโ€บStatistical Significance in A/B Testing: A Plain-English Guide
a-b-testingstatistical-significancecro

Statistical Significance in A/B Testing: A Plain-English Guide

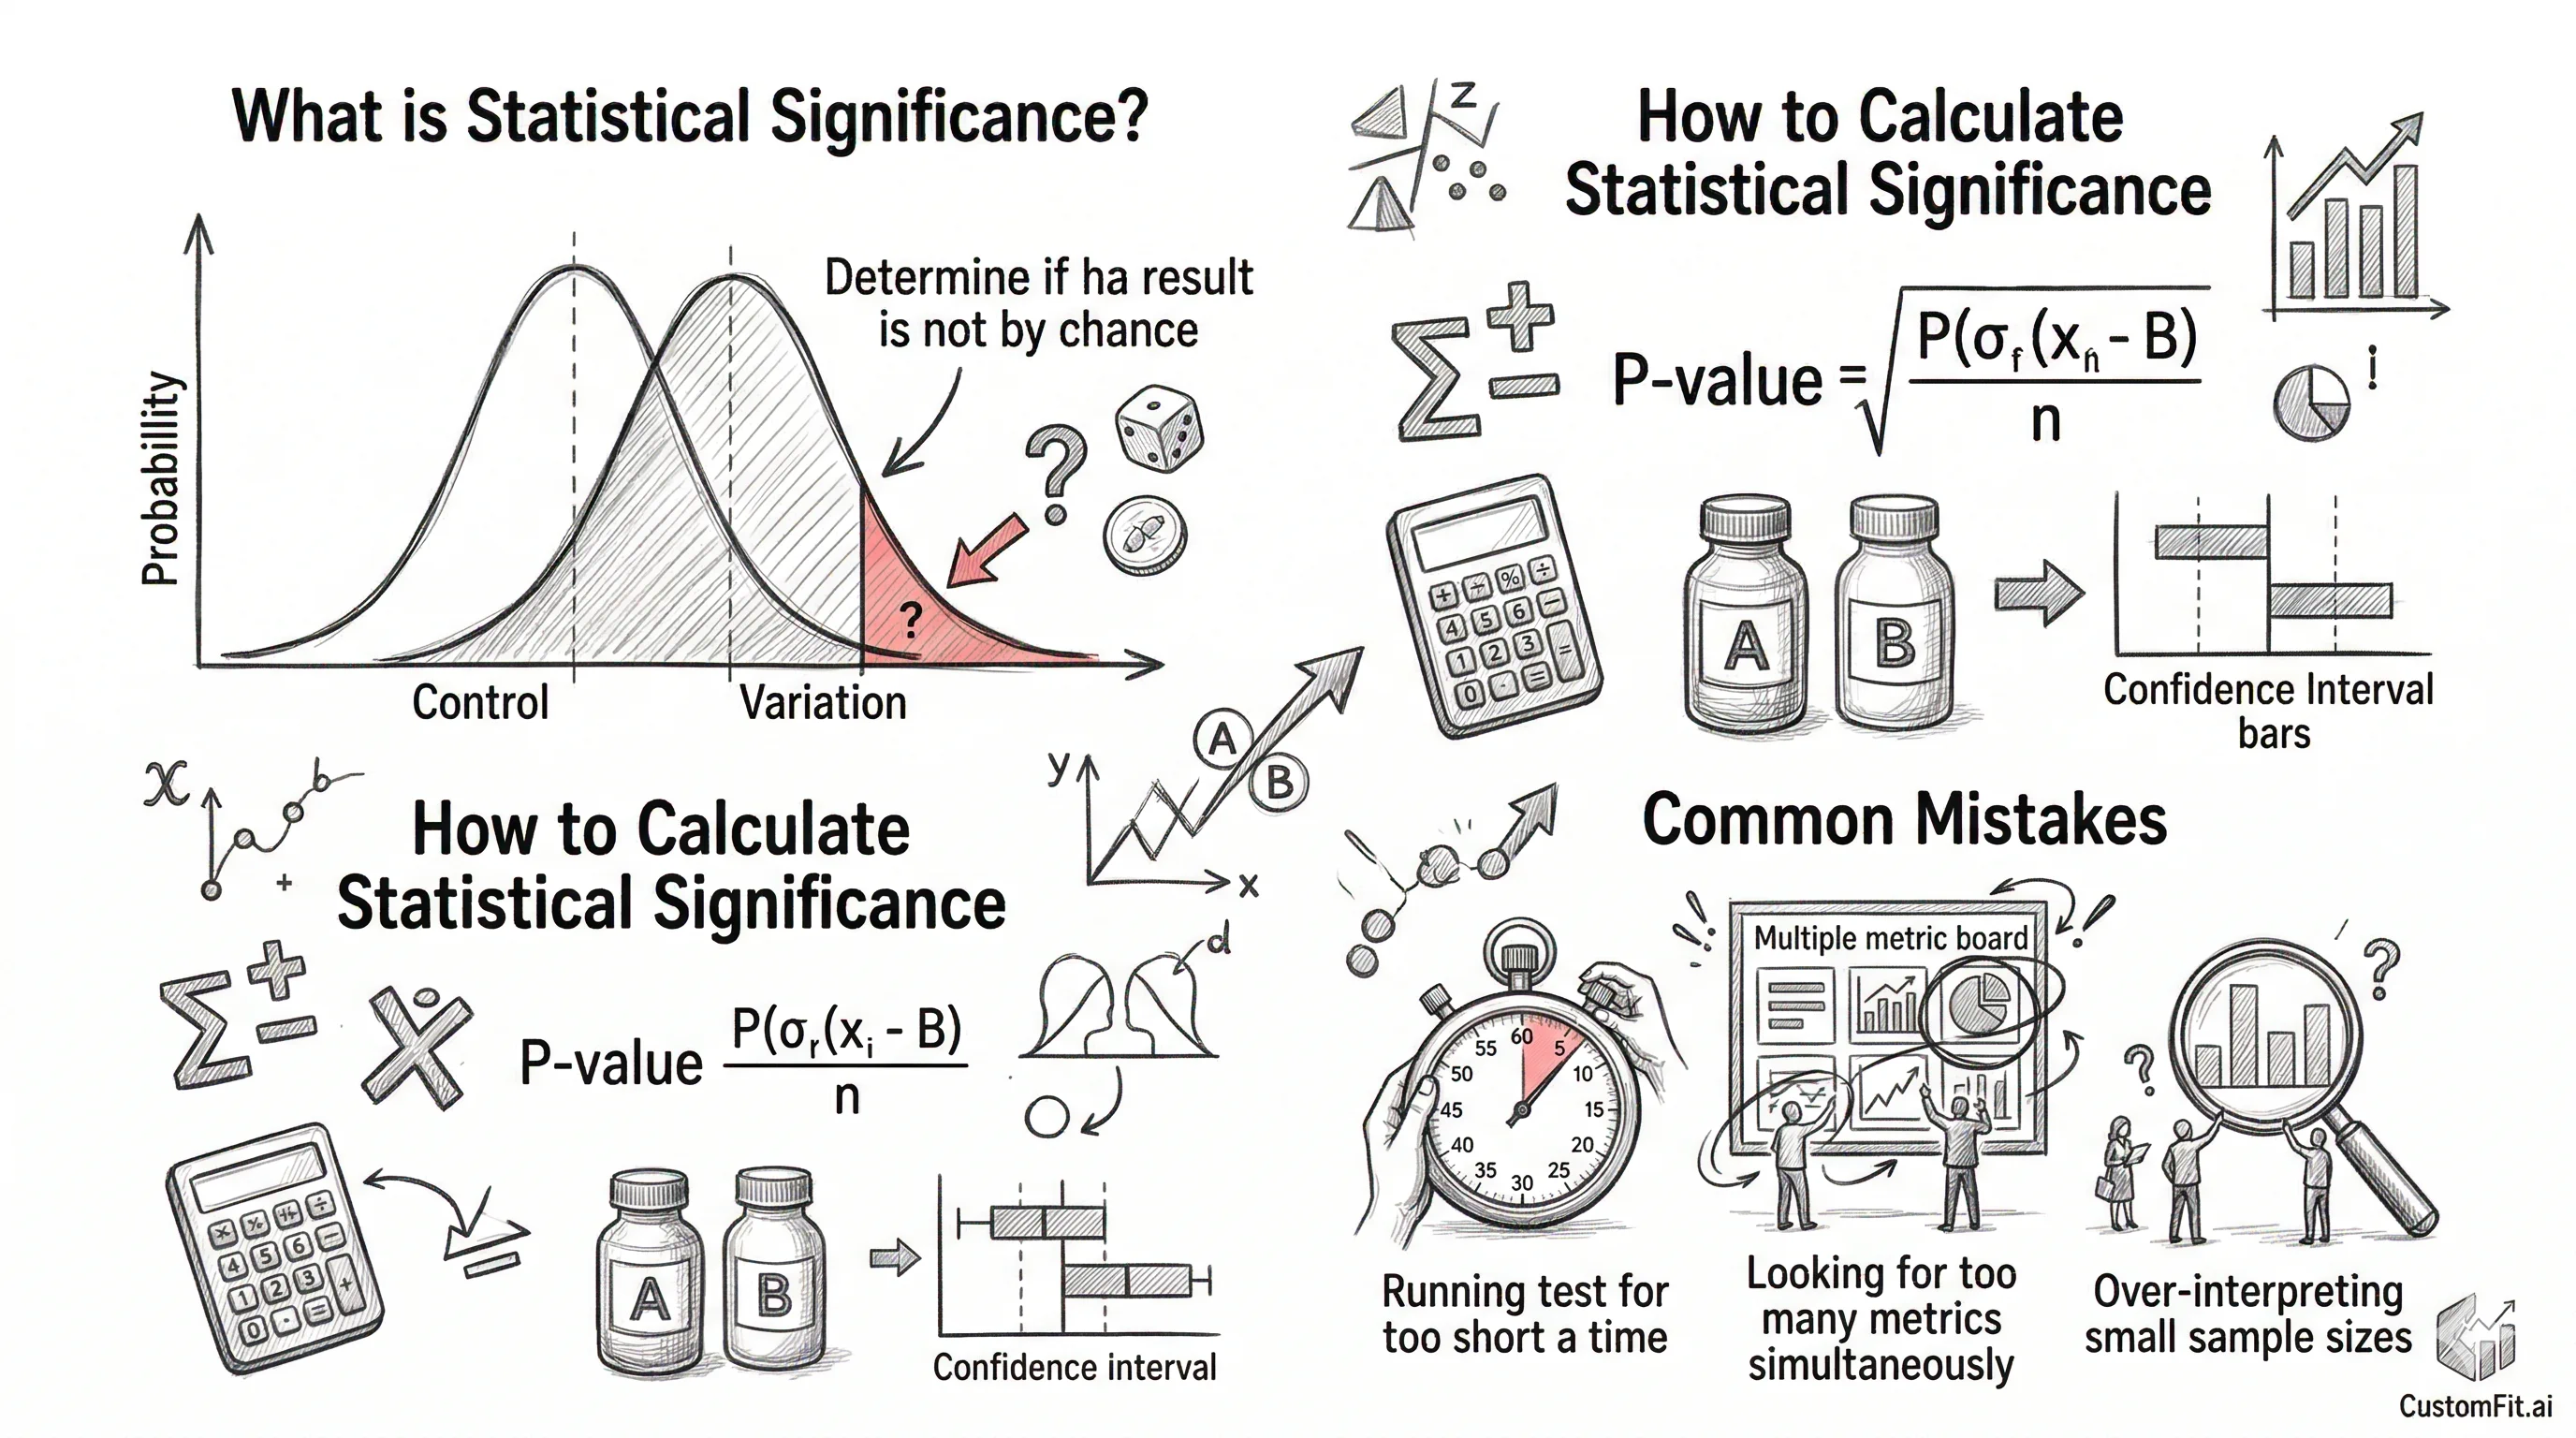
Statistical significance in A/B testing means there's less than a 5% chance your result is random. Here's what p-values, confidence levels, and sample size mean for your tests.

SJSapna JoharHead of Growth & CRO, CustomFit.aiMarch 26, 202612 min read
On this page
  1. What Statistical Significance Actually Means
  2. P-Values Explained Without the Math
  3. Confidence Level vs Confidence Interval
  4. Why 95% Is the Standard Threshold
  5. Statistical Significance vs Practical Significance
  6. Sample Size and Statistical Significance
  7. The Peeking Problem: Why Early Significance Is Misleading
  8. Bayesian vs Frequentist Significance in A/B Testing
  9. How to Check Statistical Significance: A Worked Example
  10. What to Do When You Can't Reach Significance
  11. Putting It Together
0%
Statistical Significance in A/B Testing: A Plain-English Guide

From the conversion glossary

Concepts referenced in this article, defined.

Definition
What Is Significance? Definition, Formula & Guide
Definition
What Is Lift? Definition, Formula & Guide
Definition
What Is Variant? Definition, Formula & Guide
Definition
What Is Statistical Significance? Definition & Guide
Definition
What Is Sample Size? Definition & Guide
โ† Back to Ab Testing guide
Try CustomFit.ai

Run A/B tests and personalize your store without code. 14-day free trial, no credit card.

Start free trial โ†’
Share
XLinkedInEmail

Related articles

ab testing

How A/B Testing Works: Step-by-Step Explained

A/B testing works by splitting traffic between two versions of a page, measuring which performs better on a conversion metric, and declaring a winner at statistical significance.

Sapna Joharยท 10 min read
ab testing

A/B Testing vs Split Testing: What's the Difference?

A/B testing and split testing are the same thing โ€” two names for the same experiment. Here's why the terms are used interchangeably and what actually matters.

Sapna Joharยท 7 min read
ab testing

A/B Testing vs Multivariate Testing: Which Should You Use?

A/B testing compares two page versions; multivariate testing tests multiple elements simultaneously. Learn when to use each for your ecommerce store.

Sapna Joharยท 9 min read

Start lifting conversions today.

Run rigorous A/B tests and personalize every visit on Shopify or any storefront โ€” no engineers required.

Start free trialBook a demo

Built for every D2C category

๐Ÿงด
Skincare
๐Ÿ’„
Beauty
๐ŸŒฟ
Wellness
โ˜•
F&B
๐Ÿ‘Ÿ
Apparel
๐Ÿ’
Jewelry
๐Ÿ›‹๏ธ
Home
๐Ÿผ
Baby
Live ยท Right now
Mamaearth โ€” free-shipping band +12.4% AOVGIVA โ€” festive collection page +34% revenueBellavita โ€” PDP CTA test +27.4% CVRKapiva โ€” Quiz-driven recs +9.48% CTRThe Sleep Co โ€” landing personalized 2ร— capturesPlum โ€” Returning shopper swap +18.2% CVRMamaearth โ€” free-shipping band +12.4% AOVGIVA โ€” festive collection page +34% revenueBellavita โ€” PDP CTA test +27.4% CVRKapiva โ€” Quiz-driven recs +9.48% CTRThe Sleep Co โ€” landing personalized 2ร— capturesPlum โ€” Returning shopper swap +18.2% CVR
Get in touch

Tell us about your store.

We reply within an hour during business hours. No sales pitch, no spam โ€” just answers from someone who's seen 2,400+ D2C stores.

โœ“ Reply within 1 hourโœ“ No spam, everโœ“ Free demo & setup help
โœ“ Thanks! We'll be in touch shortly.
CustomFit.ai

The all-in-one website personalization, A/B testing & CRO platform for high-growth D2C brands. Made by marketers, fueled by coffee.

in๐•โ—Žโ–ถf
Product
  • Features
  • A/B Testing
  • Personalization
  • AI Copilot
  • AI Wingman
  • AI Conversion Optimizer
  • Feature Flags
  • Widgets
  • Integrations
  • ROI Calculator
Platforms
  • Shopify
  • Shopline
  • Shoplazza
  • Salesforce
  • Chrome Extension
  • All Integrations
Resources
  • Blog
  • Playbooks
  • Webinars
  • GrowthFit Interviews
  • Free E-Books
  • Conversion Glossary
  • Case Studies
Compare
  • vs VWO
  • vs Optimizely
  • vs Google Optimize
  • vs Mutiny
  • vs Intelligems
  • vs Shoplift
  • vs AB Tasty
  • vs Convert
  • vs Kameleoon
Company
  • About Us
  • Partners
  • CustomFit Awards
  • Recognition
  • Contact
  • Privacy Policy
  • Terms & Conditions
ยฉ 2026 CustomFit.ai ยท Valley Monks Pvt Ltd ยท Made by marketers, fueled by coffee, and obsessed with conversions.
SOC 2 Type II ยท GDPR ยท CCPA ยท ISO 27001

Statistical significance in A/B testing means that the difference you observed between your control and variant is unlikely to be a result of random chance โ€” specifically, there is less than a 5% probability the result is noise. In practical terms: at 95% confidence, you can act on the result without second-guessing whether you just got lucky.

If that still feels abstract, this guide will make it concrete. We'll cover what significance actually means, why 95% became the standard, what p-values are (without the statistics degree), and โ€” critically โ€” how to apply all of this to real decisions on your ecommerce store.

What Statistical Significance Actually Means

Imagine you flip a coin 10 times and get 7 heads. Is the coin biased? Maybe. But 7 heads out of 10 isn't unusual enough to be sure โ€” it could just be chance.

Now flip it 1,000 times and get 700 heads. Now you're confident. The result is too consistent to be random.

A/B testing works the same way. When you show two versions of a product page to visitors, you're not flipping a fair coin โ€” you're asking: is this difference real, or is it just noise in a small sample?

Statistical significance is the mathematical answer to that question. It tells you: given the sample sizes and the observed difference in conversion rates, how likely is it that you'd see a gap this large purely by chance?

When that probability drops below 5%, we call the result statistically significant. We're not saying the variant is definitely better โ€” we're saying the evidence is strong enough to act on.

What significance does NOT tell you:

  • Whether the lift is large enough to matter (that's practical significance)
  • Whether the result will hold forever
  • Whether the test was designed correctly in the first place

Significance is a filter for noise. It doesn't replace judgment.

P-Values Explained Without the Math

The p-value is the number that determines statistical significance. It's also one of the most misunderstood concepts in testing.

Here's the simplest way to think about it:

The p-value is the probability of seeing your result (or a more extreme one) if there was actually no difference between control and variant.

Think of it this way. You're a judge. The variant is on trial. Your null hypothesis is "the variant is innocent โ€” there's no real difference." The p-value is the probability that you'd see evidence this strong against the variant if it were actually innocent.

  • p = 0.20 โ†’ 20% chance this result is coincidence. Not significant. Don't act.
  • p = 0.05 โ†’ 5% chance. The standard threshold. Significant.
  • p = 0.01 โ†’ 1% chance. Highly significant. Strong evidence.

Common p-value mistakes:

  1. "p = 0.05 means there's a 95% chance the variant is better." Wrong. It means there's a 5% chance the observed difference occurred by chance given no real effect. These are related but not the same thing.

  2. Using p = 0.10 as your threshold. This gives you a 10% false positive rate. Run enough tests and 1 in 10 "wins" will be noise. Your testing programme will be systematically misled.

  3. Reporting the p-value without the effect size. A p-value tells you about certainty, not magnitude. You need both.

Confidence Level vs Confidence Interval

These two terms look similar and get confused constantly. They answer different questions.

Confidence Level is the threshold you set before the test. "I want 95% confidence before I act on this result." It's a decision rule โ€” a bar you require the evidence to clear.

Confidence Interval is the range within which the true effect probably falls. If your test shows a 10% lift with a 95% confidence interval of [4%, 16%], it means: we're 95% confident the true effect is somewhere between +4% and +16%.

A narrow confidence interval means precise estimates. A wide one means you need more data.

In practice for D2C brands:

Set your confidence level at 95% before the test starts. Once you have results, look at the confidence interval โ€” if the lower bound of the interval still represents a meaningful business lift, you're in good shape. If the interval spans from -2% to +22%, your estimate is too imprecise to act on reliably, even if the midpoint looks exciting.

Why 95% Is the Standard Threshold

The 95% threshold (p < 0.05) wasn't handed down from a mountain. It was proposed by statistician Ronald Fisher in the 1920s as a pragmatic rule of thumb โ€” and it stuck.

In practice, 95% confidence represents a reasonable balance:

  • Too low (90%): 1 in 10 "winning" tests is actually noise. Too many false positives.
  • 95%: 1 in 20 winning tests is noise. Acceptable for most business decisions.
  • 99%: 1 in 100 is noise. More conservative โ€” use this for high-stakes irreversible changes.

For Indian D2C brands running experiments on product pages and checkout flows, 95% is the right default. Use 99% when you're testing something that's expensive to reverse โ€” like a major homepage redesign or a pricing structure change.

Some teams argue that 90% is fine for low-stakes, reversible tests with small traffic bases. The problem is that it creates a culture of acting on inconclusive data. The compounding effect of 10% noise across a testing programme is significant. Stick to 95%.

Statistical Significance vs Practical Significance

This is the distinction that actually matters for your business โ€” and the one most testing guides skip over.

Statistical significance tells you the result is probably real.

Practical significance tells you the result is worth acting on.

A brand with 500,000 monthly visitors can detect a 0.2% absolute CVR lift at 95% confidence. That's statistically significant. But if your current CVR is 3%, a 0.2% lift means going from โ‚น30,00,000 to โ‚น32,00,000 in revenue on a โ‚น10 crore GMV โ€” which may or may not justify the implementation cost.

Questions to ask for practical significance:

  1. What's the revenue impact? Calculate the annual revenue difference at your current traffic and AOV.
  2. What does implementation cost? If a developer needs two weeks to implement, does the revenue lift justify it?
  3. Is there a secondary metric impact? A higher add-to-cart rate that comes with a lower AOV might be a wash.

The rule of thumb: For most D2C brands, a test needs to show at least a 5% relative lift to be practically meaningful. Below that, you're optimising noise at the margin. Focus your programme on tests likely to move the needle by 10% or more.

Sample Size and Statistical Significance

You cannot talk about significance without talking about sample size. They are directly linked.

With a tiny sample, almost nothing reaches significance โ€” even if the difference is real. With a massive sample, trivial differences become "significant" even when they don't matter.

The relationship works like this:

  • Larger sample size โ†’ more power โ†’ can detect smaller effects at significance
  • Smaller effect you want to detect โ†’ need a bigger sample
  • Lower baseline CVR โ†’ need more traffic (same relative lift means fewer absolute conversions)

Example:

You're testing a product page with a 2% baseline CVR. You want to detect a 10% relative lift (from 2.0% to 2.2%). At 95% confidence, you need approximately 8,000 visitors per variant โ€” 16,000 total.

If your page gets 500 visitors per day, that's 32 days of testing. If it gets 200 visitors per day, you're looking at 80 days. Is 80 days worth testing a 0.2% absolute CVR improvement? Often not.

This is why pre-test sample size calculation matters. It forces you to be explicit about what lift you care about, and whether you have the traffic to detect it. Read our dedicated guide on A/B testing sample size for the full calculation.

The Peeking Problem: Why Early Significance Is Misleading

Here's a scenario most testing teams will recognise: you launch a test, check it after three days, and see 97% significance. You declare a winner and stop the test.

This is called peeking โ€” and it's one of the most common ways testing programmes get corrupted.

The problem is mathematical. When you run a test, your significance level fluctuates over time. Due to random variation, it's completely normal for significance to briefly spike above 95% early in the test, then fall back down as more data comes in.

If you check significance repeatedly during a test and stop as soon as it crosses 95%, you're not running a test at 95% confidence. The true false positive rate can be 25-40% depending on how often you check.

The fix:

  1. Calculate your required sample size before you start. Don't stop until you hit it.
  2. Set a fixed test duration (minimum 14 days to capture a full weekly cycle โ€” behaviour varies between weekdays and weekends).
  3. Check results once, at the end. If you genuinely need to monitor for catastrophic failures, use a Bonferroni correction or sequential testing methods.
  4. Use tools that handle this for you. Platforms like CustomFit.ai implement proper stopping rules so you're not making this mistake manually.

Bayesian vs Frequentist Significance in A/B Testing

Most A/B testing tools use frequentist statistics โ€” the framework we've described throughout this guide, with p-values and confidence levels.

There's an alternative: Bayesian statistics, which calculates the probability that one variant is better than another, incorporating prior knowledge and updating continuously as data comes in.

Frequentist (traditional):

  • Reports: p-value and confidence level
  • Decision: "Reject null hypothesis at 95% confidence"
  • Best for: Rigorous, regulated environments; academic standards
  • Limitation: Susceptible to peeking; requires pre-defined stopping rules

Bayesian:

  • Reports: "87% probability that Variant B is better than Control"
  • Decision: Act when probability of improvement exceeds your threshold
  • Best for: Faster iteration; continuous monitoring without peeking inflation
  • Limitation: Requires prior assumptions; results are harder to compare across teams

Recommendation for D2C brands: Start with frequentist 95% confidence as your standard. If your traffic is too low to reach frequentist significance in reasonable timeframes, explore Bayesian approaches โ€” but understand that "80% probability of improvement" is not the same as a statistically significant result and carries real risk of false positives.

How to Check Statistical Significance: A Worked Example

Let's run through a real calculation using realistic numbers for an Indian D2C product page.

Scenario:

  • Product: A protein supplement priced at โ‚น2,499
  • Page: Product detail page
  • Test: CTA button copy โ€” "Add to Cart" vs "Get Your Protein"
  • Duration: 21 days
  • Traffic per variant: 3,200 visitors each (6,400 total)

Results:

  • Control ("Add to Cart"): 3,200 visitors, 96 conversions โ†’ CVR = 3.0%
  • Variant ("Get Your Protein"): 3,200 visitors, 118 conversions โ†’ CVR = 3.69%

Step 1: Calculate the relative lift (3.69% - 3.0%) / 3.0% = 23% relative lift

Step 2: Plug into a significance calculator Using a standard two-proportion z-test with these inputs:

  • p1 = 0.030, n1 = 3,200
  • p2 = 0.0369, n2 = 3,200

The z-score โ‰ˆ 2.38, which corresponds to p โ‰ˆ 0.017.

Step 3: Interpret p = 0.017 < 0.05 โ†’ Statistically significant at 95% confidence. In fact, this clears the 98% confidence threshold.

Step 4: Assess practical significance At 500 monthly product page visitors (roughly 3,200 per 6-month period), 0.69% absolute CVR improvement ร— 3,200 visitors ร— โ‚น2,499 AOV = approximately โ‚น55,000 in incremental revenue per six months from this one test. Practically meaningful โ€” implement the variant.

What to Do When You Can't Reach Significance

Low-traffic stores face a real problem: they don't have enough visitors to run valid tests on most pages in a reasonable timeframe. Here's what to do.

Option 1: Test bigger changes

The minimum detectable effect you care about determines how much traffic you need. If you're testing a minor headline tweak (where a 5% lift would be meaningful), you need a lot of traffic. If you test a fundamentally different value proposition (where you might see 30%+ lift), you need far less.

Low-traffic stores should focus on bold, high-contrast tests rather than incremental tweaks.

Option 2: Move the test to a higher-traffic page

If your product page gets 100 visitors per day, test on the homepage or category page first. Get your testing muscle built up before going deeper.

Option 3: Use Bayesian methods with appropriate risk framing

A Bayesian result of "78% probability Variant B is better" is still useful information for a low-traffic brand โ€” as long as you understand the risk you're accepting. Don't treat it as equivalent to 95% frequentist confidence.

Option 4: Accept longer test durations

Some tests are worth running for 45โ€“60 days, especially for high-AOV products where even a 5% CVR improvement represents significant annual revenue. Pre-commit to the test duration and don't peek.

For the full framework on what is A/B testing and how to structure a testing programme, start with our A/B testing pillar guide.

Putting It Together

Statistical significance is not a magic number that makes decisions for you. It's a quality filter โ€” a way of ensuring that the patterns you observe in your test data are real enough to act on.

The key principles to carry forward:

  1. Always calculate required sample size before starting a test
  2. Set a 95% confidence threshold as your standard
  3. Run tests for a minimum of 14 days to capture weekly variation
  4. Never peek and stop early based on interim significance
  5. Always check practical significance alongside statistical significance โ€” a real result still needs to be a meaningful result
  6. When traffic is too low, test bolder changes or accept longer durations

CustomFit.ai handles all of this automatically โ€” significance tracking, stopping rules, sample size guidance, and results dashboards โ€” so your team can focus on what to test, not how to calculate it.

1,000+ D2C brands use CustomFit.ai to run statistically valid A/B tests without needing a data science team. 14-day free trial ยท No credit card required ยท Setup in under 30 minutes.

Start Your Free Trial ยท Book a Demo