From the conversion glossary
Concepts referenced in this article, defined.
A/B testing is a method of comparing two versions of a webpage to find which performs better. Learn the complete A/B testing process, core concepts, and how to run your first test without a developer.
Concepts referenced in this article, defined.
Run rigorous A/B tests and personalize every visit on Shopify or any storefront — no engineers required.
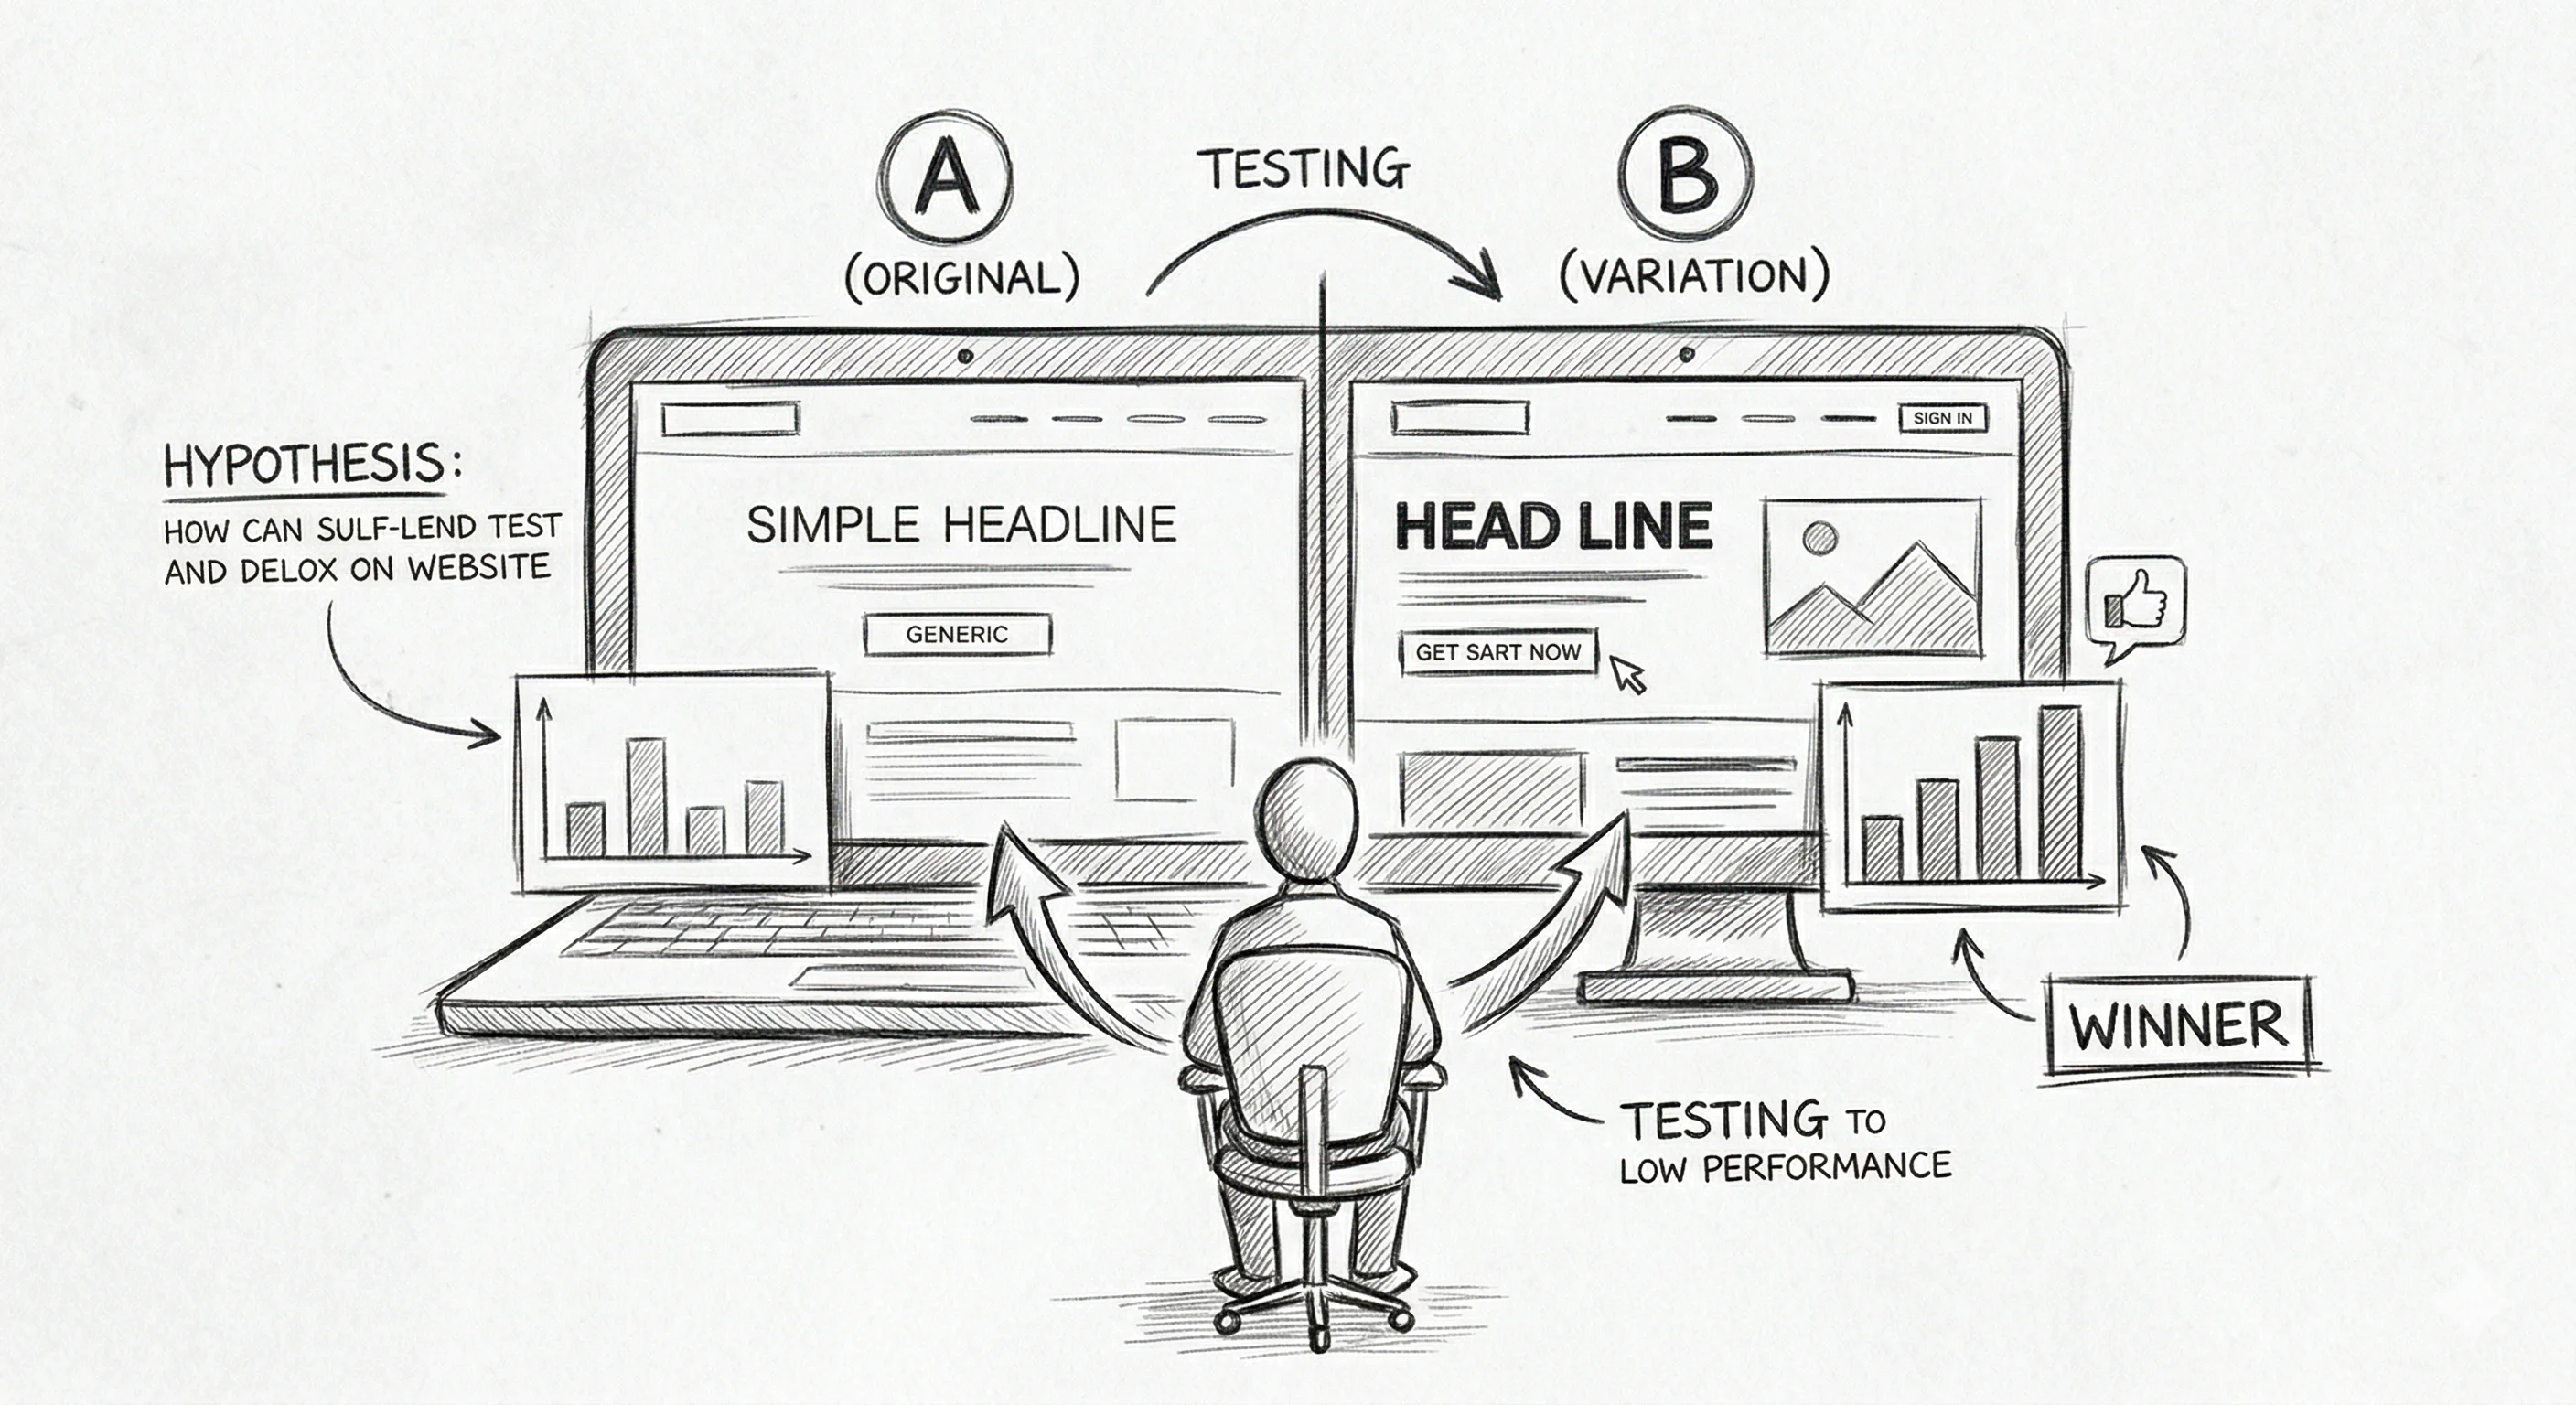
A/B testing (also called split testing) is a controlled experiment in which two versions of a webpage, email, or app element — a control (the original, Version A) and a variant (the changed version, Version B) — are shown to different segments of your audience simultaneously. You measure which version performs better on a specific metric, then ship the winner.
It's the most reliable method for making conversion rate decisions based on real user behavior rather than assumptions. Every major D2C brand — from Bellavita and Kapiva to global brands like Amazon and Booking.com — uses A/B testing as the core engine of their growth.
At its simplest, A/B testing answers one question: "Which version works better for my users?"
You take an element — a headline, a button, an image, a price display — create an alternative version, split your traffic between the two, and let data decide. No gut feelings. No design debates. No HiPPO decisions (Highest Paid Person's Opinion). Just behavior.
| Component | What It Is | Example |
|---|---|---|
| Control (A) | Your current, unchanged version | "Add to Cart" button in red |
| Variant (B) | Your modified version | "Add to Cart" button in green |
| Traffic split | How visitors are divided | 50% see A, 50% see B |
| Goal metric | What you're measuring | Add-to-cart rate |
| Statistical significance | Confidence the result isn't random | 95% confidence |
| Winner | The version declared better | Whichever hits significance first |
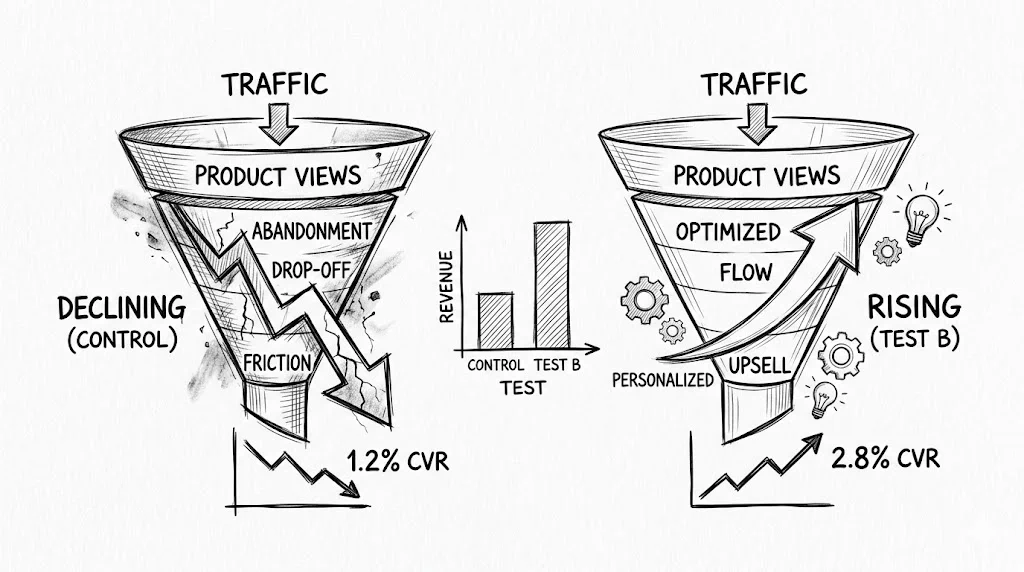
A/B testing is the foundation of Conversion Rate Optimization (CRO) — the practice of systematically improving the percentage of visitors who take a desired action on your site.
Because you need a control. Without running A (your original) and B (your change) simultaneously, you can't isolate whether any improvement is due to your change or external factors — seasonality, a marketing campaign going live, a news event, a traffic source shift. Running both at the same time eliminates those variables.
This is what separates A/B testing from simply launching a redesign and hoping metrics improve.
If you run a D2C brand in India, here's the math problem you face:
You're spending ₹5-50 lakhs per month on performance marketing. Your site converts at 1.5-2%. That means 98-98.5% of everyone you're paying to bring to your site leaves without buying. Every rupee you spend on ads is working at less than 2% efficiency.
A/B testing doesn't reduce your ad spend. It increases what you get from every rupee already spent.
| Monthly visitors | Current CVR | Current orders | After +1% CVR | Extra orders/month |
|---|---|---|---|---|
| 50,000 | 2.0% | 1,000 | 3.0% | +500 |
| 100,000 | 1.5% | 1,500 | 2.5% | +1,000 |
| 200,000 | 1.8% | 3,600 | 2.8% | +2,000 |
If your average order value is ₹800, those extra 500 orders per month from 50,000 visitors translate to ₹4 lakh in additional monthly revenue — from the same ad spend.
This is why Bellavita used A/B testing to achieve an 11% CVR lift, and Kapiva achieved a 9.48% CVR improvement. At their traffic volumes, those numbers translate directly to crores in annual incremental revenue.
Reason 1: Your intuition is wrong more than you think. Marketing and product teams are right about which variant will win less than 50% of the time when properly tested. What looks great in a design review often underperforms with real users.
Reason 2: Your audience is not you. A founder in Mumbai designing for a customer in Jaipur buying during a festive sale has different context, device, and motivation than any internal reviewer.
Reason 3: The competitive cost of standing still. Your competitors who test ship winners every two weeks. After 12 months, they've accumulated hundreds of micro-improvements that compound. A site converting at 3.5% vs yours at 2.0% wins the same ad auction at a lower effective CPA.
Before running your first test, you need to understand these concepts. Getting them wrong is the most common source of bad decisions from A/B testing.
A hypothesis is the structured statement of what you believe will happen and why. Good hypotheses look like this:
"We believe that changing the headline on our product page from 'Buy Now' to 'Add to Cart — Free Delivery' will increase the add-to-cart rate because it addresses the #1 objection we see in customer support queries (delivery cost anxiety)."
Hypothesis format: "We believe [change] will [outcome] because [evidence/reason]."
Never run a test without a hypothesis. Tests without hypotheses are guesses. Hypotheses connect your testing program to customer research and make your wins replicable.
This is the one metric that determines your winner. Pick only one primary metric per test:
Why only one? If you track multiple metrics and one improves while another declines, you have no winner — you have a dilemma. Pick the metric that most directly connects to revenue.
Statistical significance tells you how confident you can be that the difference you see between your variants is real — not random noise.
The standard threshold in ecommerce A/B testing is 95% statistical significance (also written as p < 0.05). This means:
"If there were no real difference between A and B, there's only a 5% chance we'd observe a gap this large just from random variation."
If you declare a winner at 80% significance, you'll make the wrong call roughly 1 in 5 times. Those wrong calls compound: 10 tests at 80% confidence means ~2 shipped losers being treated as winners.
The p-value is the specific number behind statistical significance. A p-value of 0.04 means there's a 4% probability the observed difference is due to chance — which is below the 0.05 threshold, so your result is significant.
Common misunderstanding: A lower p-value does not mean a larger effect. It only means you're more confident the effect is real, whatever its size.
The confidence interval gives you a range for the true effect size. If your variant shows a +8% improvement in CVR with a 95% confidence interval of [+3%, +13%], the true improvement is likely between 3% and 13%.
When comparing variants, look at where the confidence intervals overlap. If they don't overlap, you have a clear winner.
Sample size is the number of visitors each variant needs before you can draw valid conclusions. It depends on:
Use an A/B test calculator before starting to know your required sample size. Starting a test without this calculation is the #1 reason tests end too early.
Minimum duration: 14 days, regardless of traffic volume. This captures full weekly cycles — your Monday shoppers behave differently from your Saturday browsers, and your weekday traffic mix is different from your weekend mix.
Maximum duration: 90 days. Tests running longer than 3 months are affected by seasonal changes, new competitors, and shifting audience composition that make your results less reliable.
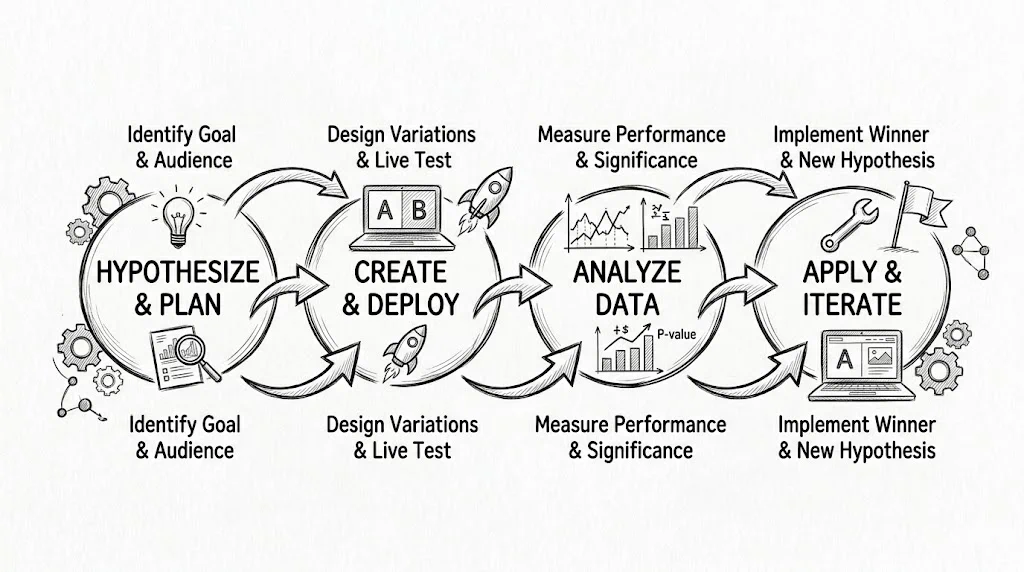
A properly run A/B test follows eight consistent steps. Skip any of them and your results become unreliable.
Before forming a hypothesis, understand where your funnel leaks. Use:
Example: Your analytics show 60% of users who reach the checkout initiation step drop off before completing payment. Heatmaps show most are not scrolling to the payment section. Problem identified: the checkout page is too long.
Using the data from Step 1, write your hypothesis in the structured format:
"We believe that moving the payment section above the address form in checkout will increase the checkout completion rate because users are dropping off before reaching the payment section — suggesting they're overwhelmed before they get there."
Choose the one conversion metric that determines your winner. For the checkout example: checkout completion rate.
Set your secondary metrics (average order value, revenue per visitor) to monitor for regressions — but they won't determine your winner.
Use an A/B test sample size calculator. Enter:
The calculator tells you how many visitors each variant needs. Divide by your daily checkout traffic to get your minimum test duration. Set an end date before launching.
Create Version B with your proposed change. Keep everything else identical — same page structure, same copy, same images — except the one element you're testing.
If you change multiple things simultaneously, you can't know which change caused the result.
Set up your test with:
Let it run until you hit both your required sample size AND your minimum duration. Do not look at results in the first 3-4 days. Do not stop early because "B looks like it's winning."
When your test reaches its predetermined end date and sample size:
A result can be statistically significant but practically irrelevant. A 0.1% lift at 97% confidence is real but not worth shipping if it doesn't move your business.
Implement the winning variant. Update your conversion research documentation with:
Documentation is what turns a testing program into institutional knowledge.
Almost every element of your ecommerce experience can be tested. Here are the highest-impact areas for D2C brands:
| Element | Test Idea | What to Measure |
|---|---|---|
| Headline | Benefit-led vs. feature-led | Add-to-cart rate |
| Product images | Lifestyle vs. studio | Add-to-cart rate |
| CTA button | "Add to Cart" vs. "Buy Now" | Add-to-cart clicks |
| CTA color | Red vs. green vs. brand color | Click rate |
| Price display | Full price vs. EMI options vs. savings highlighted | Add-to-cart rate |
| Social proof | Star ratings visible vs. hidden, review count | Purchase CVR |
| Urgency/scarcity | "Only 3 left" vs. no urgency | Add-to-cart rate |
The most common form. Control vs. one variant. Fastest to reach significance. Best for most ecommerce use cases.
Testing three or more variants simultaneously. Useful when you have multiple strong hypotheses but requires significantly more traffic to reach significance for each variant.
If you test 4 variants, each needs the same sample size as a two-variant test. Your test takes 3-4x as long as a standard A/B test for the same traffic volume.
Instead of modifying elements on the same URL, you create an entirely different page at a new URL and split traffic between the two URLs. Used for:
Simultaneously tests multiple elements (e.g., headline + image + CTA) and all their combinations. Reveals interaction effects — "the green button wins, but only when paired with the benefit-led headline."
Requires 10-20x more traffic than a standard A/B test. Only suitable for very high-traffic pages (10,000+ daily visitors to that page).
Tests that happen at the server level rather than in the browser. Used for:
No visual flicker (no flash of the original page before the variant loads). More complex to implement.
Instead of a fixed 50/50 split, bandit testing dynamically reallocates traffic to the winning variant as evidence accumulates. More traffic goes to the winning variant over time, reducing the revenue cost of running the losing variant.
Tools like CustomFit.ai use AI-powered bandit testing to maximize revenue during the test — not just after it. Particularly useful for high-stakes tests where showing the losing variant has a measurable cost.
Choosing the right tool depends on your technical resources, traffic volume, and testing goals.
| Tool | Best for | Pricing | Shopify native | No-code editor | D2C metrics |
|---|---|---|---|---|---|
| CustomFit.ai | D2C and ecommerce brands | From $250/mo | ✓ | ✓ | ✓ |
| VWO | Enterprise, general web | From $199/mo | — | ✓ | — |
| Optimizely | Enterprise, developer teams | $50K+/yr | — | — | — |
| AB Tasty | Mid-market, European focus | Custom | — | ✓ | — |
| Google Optimize | — | — | — | — |
For D2C and ecommerce brands specifically:
Revenue-first metrics: Can the tool track revenue per visitor, average order value, and add-to-cart rate — not just clicks and page views?
No-code visual editor: Can your marketing team launch a test without filing a developer ticket? If not, your testing velocity will be determined by engineering capacity.
Platform integration: Native Shopify, WooCommerce, or BigCommerce integration means less setup, fewer tracking gaps, and accurate order attribution.
Statistical methodology: Does the tool use Bayesian or frequentist statistics? Can you configure significance thresholds? Does it protect against the peeking problem?
Audience segmentation: Can you run tests only for new visitors? Only for users who added to cart but didn't purchase? Segmented tests often reveal insights that site-wide tests miss.
CustomFit.ai was built specifically for this use case — a no-code visual editor, Shopify-native integration, and ecommerce-specific metrics out of the box. You can launch your first test in under 30 minutes with no developer involvement.
Bellavita, a premium Indian fragrance and personal care brand, used A/B testing to optimize their product pages. By testing different combinations of hero imagery, social proof placement, and CTA copy, they achieved an 11% improvement in conversion rate — a result that at their traffic volume translated to significant incremental revenue from the same ad spend.
The lesson: Even premium lifestyle brands with strong branding need to test. What looks beautiful in a brand photoshoot and what converts are often different things.
Kapiva, an Ayurvedic wellness brand, focused their A/B tests on product page elements that addressed purchase-intent signals specific to their category — ingredient transparency, clinical evidence placement, and trust signals around authenticity.
Their 9.48% CVR lift came from changes that would have been blocked without test data to justify them internally.
The lesson: Category-specific objections need category-specific tests. Generic best practices don't always apply.
Indian D2C brands face a unique testing calendar. Festive seasons (Diwali, Navratri, Durga Puja) drive 30-40% of annual revenue for many categories in 4-6 weeks. The brands winning these periods are the ones who entered the season with already-tested winners:
You can't A/B test during your Diwali sale — traffic spikes too fast and test results are contaminated by behavioral anomalies. You test before and ship the winner for the sale.
The most important rule. If you change your headline, image, and button color in a single variant, and it wins, you don't know what drove the win. You can't reapply the learning to other pages. You can't build on it.
Exception: radically different page designs where you're testing a complete new layout concept. Call these "explore" tests, not "optimize" tests.
A test without a hypothesis is a random change followed by data-fishing. Even if it produces a winning variant, you can't replicate the insight or understand what principle underlies it.
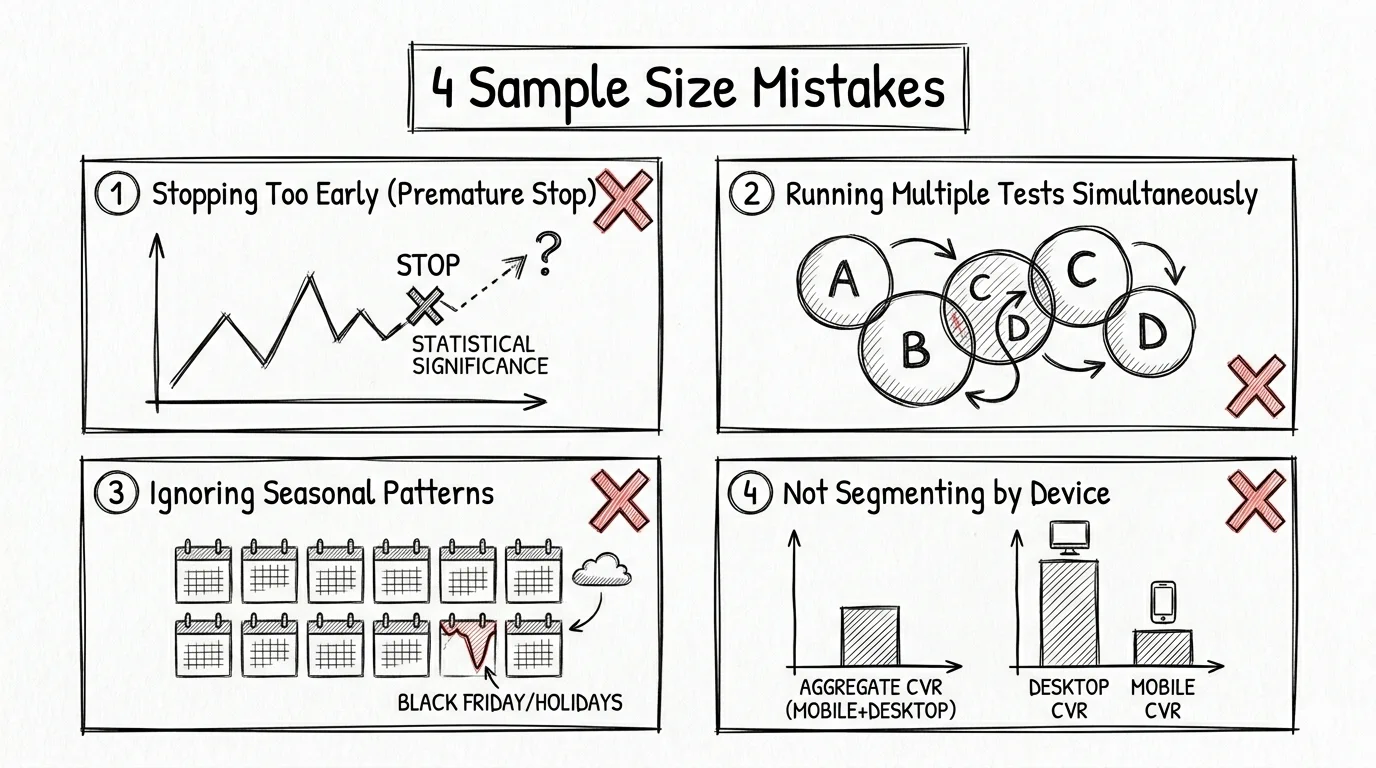
Calculate required sample size before starting. Set a calendar end date. Commit to it. Do not stop early — not when variant B is crushing it at day 3, and not when A is clearly winning at day 5. Early stopping creates false positives at an alarming rate.
A test that shows a 5% lift overall might be driven entirely by mobile users (while desktop shows no effect), or new visitors (while returning visitors show a negative effect). Always segment by:
Click-through rates and add-to-cart rates are proxies. The only metric that ultimately matters is revenue per visitor. It's possible for a variant to increase add-to-cart rate while decreasing purchase completion rate — a net loss.
Always include RPV (revenue per visitor) as a secondary metric in every ecommerce test.
Avoid running two tests on the same page simultaneously. Interaction effects between tests contaminate results. Test one hypothesis on a page, ship the winner (or the control if no winner), then move to the next test.
80% significance means you'll be wrong 1 in 5 times. Across a 20-test program, that's 4 shipped losers. Those losers compound and eat into the gains from your actual winners.
Set a firm rule in your team: 95% minimum, no exceptions.
The #1 mistake in ecommerce A/B testing. You check results after 3 days, variant B is up 15%, and you call it. Two weeks later when the test would have naturally concluded, B would have shown a -2% difference.
Early stopping happens because we're impatient. Set your end date in advance and don't check results until it arrives. Modern A/B testing tools (including CustomFit.ai) can lock results until the test completes.
You test a variant on a page that gets 200 visitors per day. You need 2,000 visitors per variant. Your test needs 20 days minimum — and if you're testing a 5% lift, you need 60+ days. By day 60, the season has changed and your results are confounded.
Only test pages with enough traffic to reach significance in a reasonable timeframe (ideally under 30 days).
You launch a test on your product page. Three days in, your designer updates the page template across the entire site. Your test is now invalid — the control and variant are no longer properly isolated.
Lock pages under test. Communicate active tests to your entire team.
If a user is in three simultaneous tests on different page elements, interaction effects between those tests make all three results unreliable. Manage your test portfolio and avoid overlapping the same audience in multiple tests.
If 65% of your traffic is mobile (common for Indian D2C brands) and your variant is optimized for desktop, your site-wide results will underperform the actual mobile-specific effect. Always analyze by device type before declaring a winner.
An inconclusive test (no statistical significance achieved) is valuable data. It means your hypothesis was wrong, or the effect is too small to matter at your traffic volume. Document the learning, update your understanding of your users, and form a better hypothesis next time.
Traditional A/B testing requires you to fix your sample size in advance and not peek at results until the end. This is hard to enforce in practice.
Sequential testing statistical methods (used by some advanced tools) allow you to continuously monitor a test without inflating your false positive rate. They're mathematically valid to check anytime — but they typically require more traffic to reach the same power as fixed-horizon tests.
Frequentist (traditional): Uses p-values and confidence intervals. Requires pre-specified sample sizes. Answer: "If I ran this experiment infinite times, the true effect would fall in this range X% of the time."
Bayesian: Starts with prior beliefs and updates them with data. Can be interpreted more intuitively: "Given this data, there's a 95% probability that Variant B is better than Variant A." Naturally handles early stopping without inflating error rates.
Both are valid. Bayesian is increasingly preferred for ecommerce use cases because it's easier to communicate to non-statisticians and handles real-world testing constraints better.
If you run 20 tests and use 95% significance for each, by pure statistics you'd expect 1 false positive — not because something was wrong with your testing, but because of probability. As your testing program scales, implement corrections (Bonferroni correction or false discovery rate controls) if you're running large numbers of simultaneous tests.
When you test multiple elements simultaneously, the winning combination isn't always the one with individually-best-performing elements. A bold headline might only outperform with a specific image; combined with a different image, it underperforms.
This is why MVT (multivariate testing) requires significantly more traffic — you need to see enough data for every combination.
When you launch a variant that looks noticeably different from the control, returning visitors (who've seen the original) may interact differently with it simply because it's new — not because it's better. This novelty effect typically fades within 1-2 weeks.
If your test involves a significant visual change, analyze returning visitor segments separately and weight your results accordingly.
You don't need a six-month CRO program to start testing. Here's how to run your first meaningful A/B test in under a week:
Day 1: Install a no-code A/B testing tool. CustomFit.ai connects to Shopify in one click from the App Store. For other platforms, paste a single JavaScript snippet.
Day 2: Check your analytics. Find the page with the highest traffic that also has a meaningful conversion step (product page, cart, checkout). Note the current conversion rate.
Day 3: Identify one change to test. Look at your product pages — is your primary CTA above or below the fold on mobile? Is your headline describing what the product is or what benefit the customer gets?
Day 4: Write your hypothesis. "We believe [X] will improve [metric] because [evidence]."
Day 5: Set up the test using the visual editor. Click the element, make the change, set your conversion goal, calculate your sample size, set your end date. Launch.
Day 6-20+: Let it run. Do not check results daily. Check at the predetermined end date.
This guide is part of our comprehensive A/B Testing knowledge base. Continue learning:
1,000+ D2C brands use CustomFit.ai to run A/B tests and personalize their website — without writing code, without developer tickets, without waiting weeks to get a test live.
14-day free trial. No credit card required. Setup in under 30 minutes.
Start Your Free Trial · Book a Demo
Setup takes under 30 minutes. No developer needed. Works with Shopify, WooCommerce, BigCommerce, Salesforce Commerce Cloud, and any custom stack.