From the conversion glossary
Concepts referenced in this article, defined.
Statistical significance tells you whether your A/B test result is real or random noise. Here's a plain-English explanation of confidence levels, p-values, and how to know when to trust your results.
Concepts referenced in this article, defined.
Run rigorous A/B tests and personalize every visit on Shopify or any storefront — no engineers required.
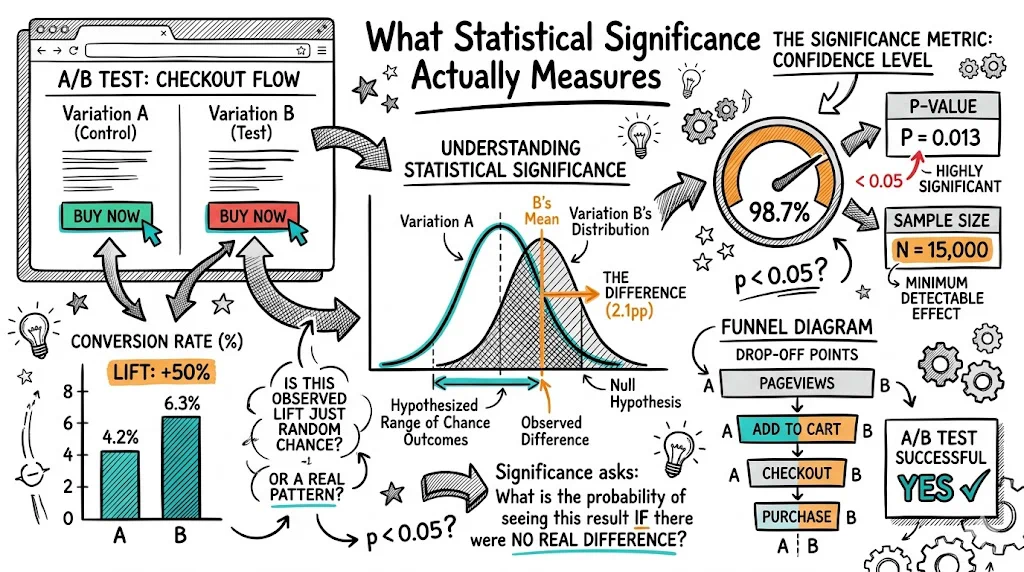
Statistical significance is the measure that tells you whether your A/B test result reflects a real difference in user behavior — or just random noise. Without it, you're making product decisions based on luck.
This guide explains statistical significance in plain English — no statistics degree required.
Imagine you flip a coin 10 times and get 7 heads. Does that mean the coin is biased? Maybe. But 7 heads in 10 flips can also happen by chance — it's not unusual.
A/B testing has the same problem. If 52 out of 100 visitors converted with variant B, and 48 out of 100 converted with variant A, does that mean B is better? Or is the 4-visitor difference just noise?
Statistical significance answers this question with a probability.
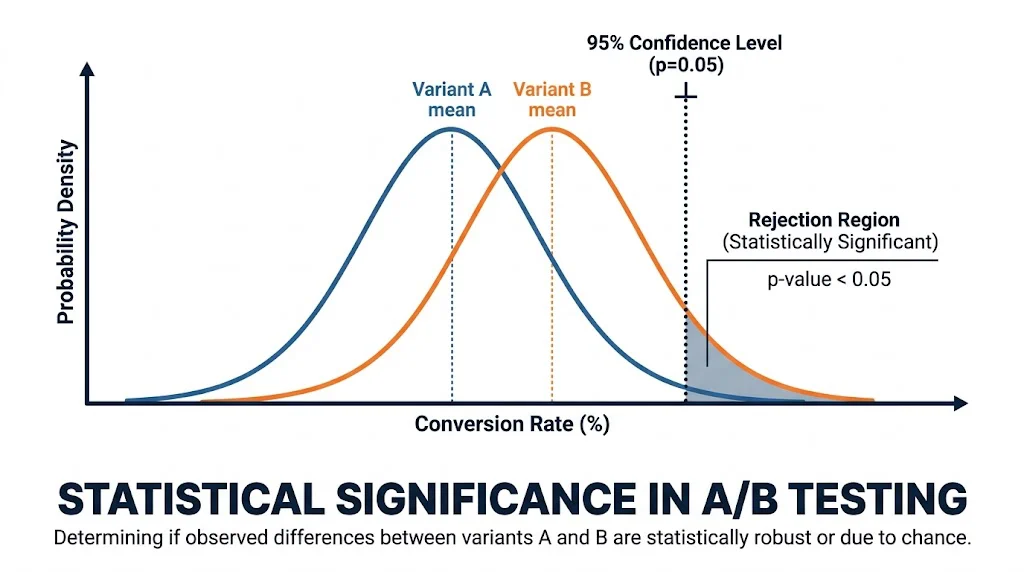
When a test reports "95% statistical significance," it means:
There is only a 5% probability that the difference between control and variant occurred by random chance.
Another way to say it: if you ran this same test 100 times, you'd expect to see a false positive (a difference that isn't real) only 5 times.
95% is the standard threshold used by CustomFit.ai and most professional A/B testing tools. Some teams use 90% for lower-stakes tests or 99% for high-traffic, high-revenue decisions.
| Significance Level | False Positive Rate | When to Use |
|---|---|---|
| 90% | 10% | Low-stakes tests, early exploration |
| 95% | 5% | Standard for most A/B tests (recommended) |
| 99% | 1% | High-stakes decisions (pricing, checkout changes) |
The higher your confidence threshold, the more traffic you need and the longer your test runs.
Statistical power is the flip side: the probability of detecting a real effect if one exists. Tests with low power miss real winners.
Standard recommendation: 80% statistical power. This means if your variant truly is better, you have an 80% chance of detecting it.
Low power = high rate of false negatives (you miss real improvements).
The way to increase power: increase sample size.
MDE is the smallest improvement you want to be able to detect. If your conversion rate is 2% and you want to detect a 10% relative improvement (from 2.0% to 2.2%), that's your MDE.
Smaller MDE = more traffic needed. If you're trying to detect a 1% relative improvement, you'll need roughly 10x more traffic than detecting a 20% improvement.
Practical guidance: For most ecommerce A/B tests, set your MDE at 10-15% relative improvement. Testing for smaller effects requires more traffic than most sites can provide in a reasonable timeframe.
Use this rough guide (95% confidence, 80% power, 10% relative MDE):
| Current Conversion Rate | Visitors Needed (per variant) |
|---|---|
| 1% | ~8,500 |
| 2% | ~4,300 |
| 3% | ~2,900 |
| 5% | ~1,700 |
These are per variant — multiply by 2 for a standard A/B test with one control and one variant.
CustomFit.ai estimates this automatically: enter your current conversion rate and traffic volume, and it tells you how many days your test needs to run.
Peeking — checking results before your test has run long enough — is the most common statistical mistake in A/B testing.
Here's why it's dangerous: statistical significance fluctuates during a test. If you check results after 3 days, there's a high probability you'll see either a false positive (the variant looks like it's winning when it isn't) or a false negative. Early significance readings are unreliable.
Rules to prevent peeking:
Most A/B testing tools (including CustomFit.ai) offer two statistical models:
Frequentist (traditional p-value approach):
Bayesian (probability-based approach):
Both are valid. For teams new to A/B testing, frequentist is simpler to communicate to stakeholders. For teams running many concurrent tests, Bayesian offers more flexibility.
Trust your A/B test results when:
Be cautious when:
CustomFit.ai shows:
When all four indicators are green, you can ship the winner with confidence.
Continue reading:
CustomFit.ai handles the statistics so you don't have to. Start your free trial and run your first statistically valid A/B test today.