From the conversion glossary
Concepts referenced in this article, defined.
A comprehensive CRO guide covering landing pages, product pages, checkout flows, and analytics — built for D2C and ecommerce brands that want measurable revenue growth.
Concepts referenced in this article, defined.
Run rigorous A/B tests and personalize every visit on Shopify or any storefront — no engineers required.
Conversion Rate Optimization (CRO) is the systematic process of increasing the percentage of website visitors who take a desired action — making a purchase, adding to cart, signing up, or any other conversion goal your business cares about.
Conversion Rate = (Conversions ÷ Total Visitors) × 100
For D2C brands spending heavily on acquisition, CRO is the highest-leverage investment available: improvements to your conversion rate apply to every rupee of traffic you're already paying for. A brand doing ₹1 crore/month that improves its conversion rate by 20% generates ₹20 lakh more revenue — without increasing ad spend.
Most D2C brands allocate 95%+ of their growth budget to acquisition — paid social, Google Ads, influencer marketing. CRO is systematically underinvested, despite delivering the highest ROI of any growth discipline.
Consider the math:
| Scenario | Monthly Visitors | Conversion Rate | Monthly Revenue |
|---|---|---|---|
| Current | 100,000 | 2% | ₹40 lakh |
| +50% more traffic (expensive) | 150,000 | 2% | ₹60 lakh |
| +50% better conversion (CRO) | 100,000 | 3% | ₹60 lakh |
Both scenarios produce the same revenue. The CRO path typically costs a fraction of the traffic acquisition path — and it compounds with every future traffic increase.
Before optimizing, know exactly where you stand. Set up tracking for:
The segments with the largest conversion rate gaps are your highest-priority optimization targets.
Quantitative data tells you where visitors drop off. Qualitative research tells you why.
Heatmap analysis: See where visitors click, scroll, and ignore on each page. Identify which elements get attention and which are missed entirely.
Session recording review: Watch real visitor sessions. Look for: rage clicks (frustrated tapping), dead clicks (clicking on non-clickable elements), form field hesitation, and exit patterns.
Exit surveys: Ask visitors who are about to leave: "What stopped you from completing your purchase?" Common answers reveal friction you wouldn't find in analytics.
User testing: Have 5–10 target customers narrate their experience as they browse your site. Five user tests consistently surface 80% of usability issues.
Customer support log analysis: Look for recurring questions — "Do you ship to X?", "What is your return policy?" — these reveal information gaps on product pages.
Turn research findings into specific, testable hypotheses:
"If we add free shipping threshold progress bar ('Add ₹250 for free shipping') to the cart page because our session recordings show 40% of cart abandonments happen after users see the shipping cost, we expect checkout initiation rate to increase by 15%."
A strong hypothesis includes:
Every hypothesis should be validated through a controlled experiment before permanent implementation. Using CustomFit.ai:
Never implement changes based on opinion alone, even if the opinion is from a senior executive. Data wins.
Ship the winning variant to 100% of traffic. Document the learning (win and loss alike). Move immediately to the next hypothesis.
The most successful CRO programs run 2–4 tests per month. With a typical 30–40% win rate, that's 8–16 conversion improvements per year — each compounding on the previous.
Product pages are where purchase decisions are made. They are consistently the highest-ROI pages for CRO investment.
What to optimize:
Above the fold: Does the product image, title, price, and primary CTA appear without scrolling on mobile? If not, that's your first fix.
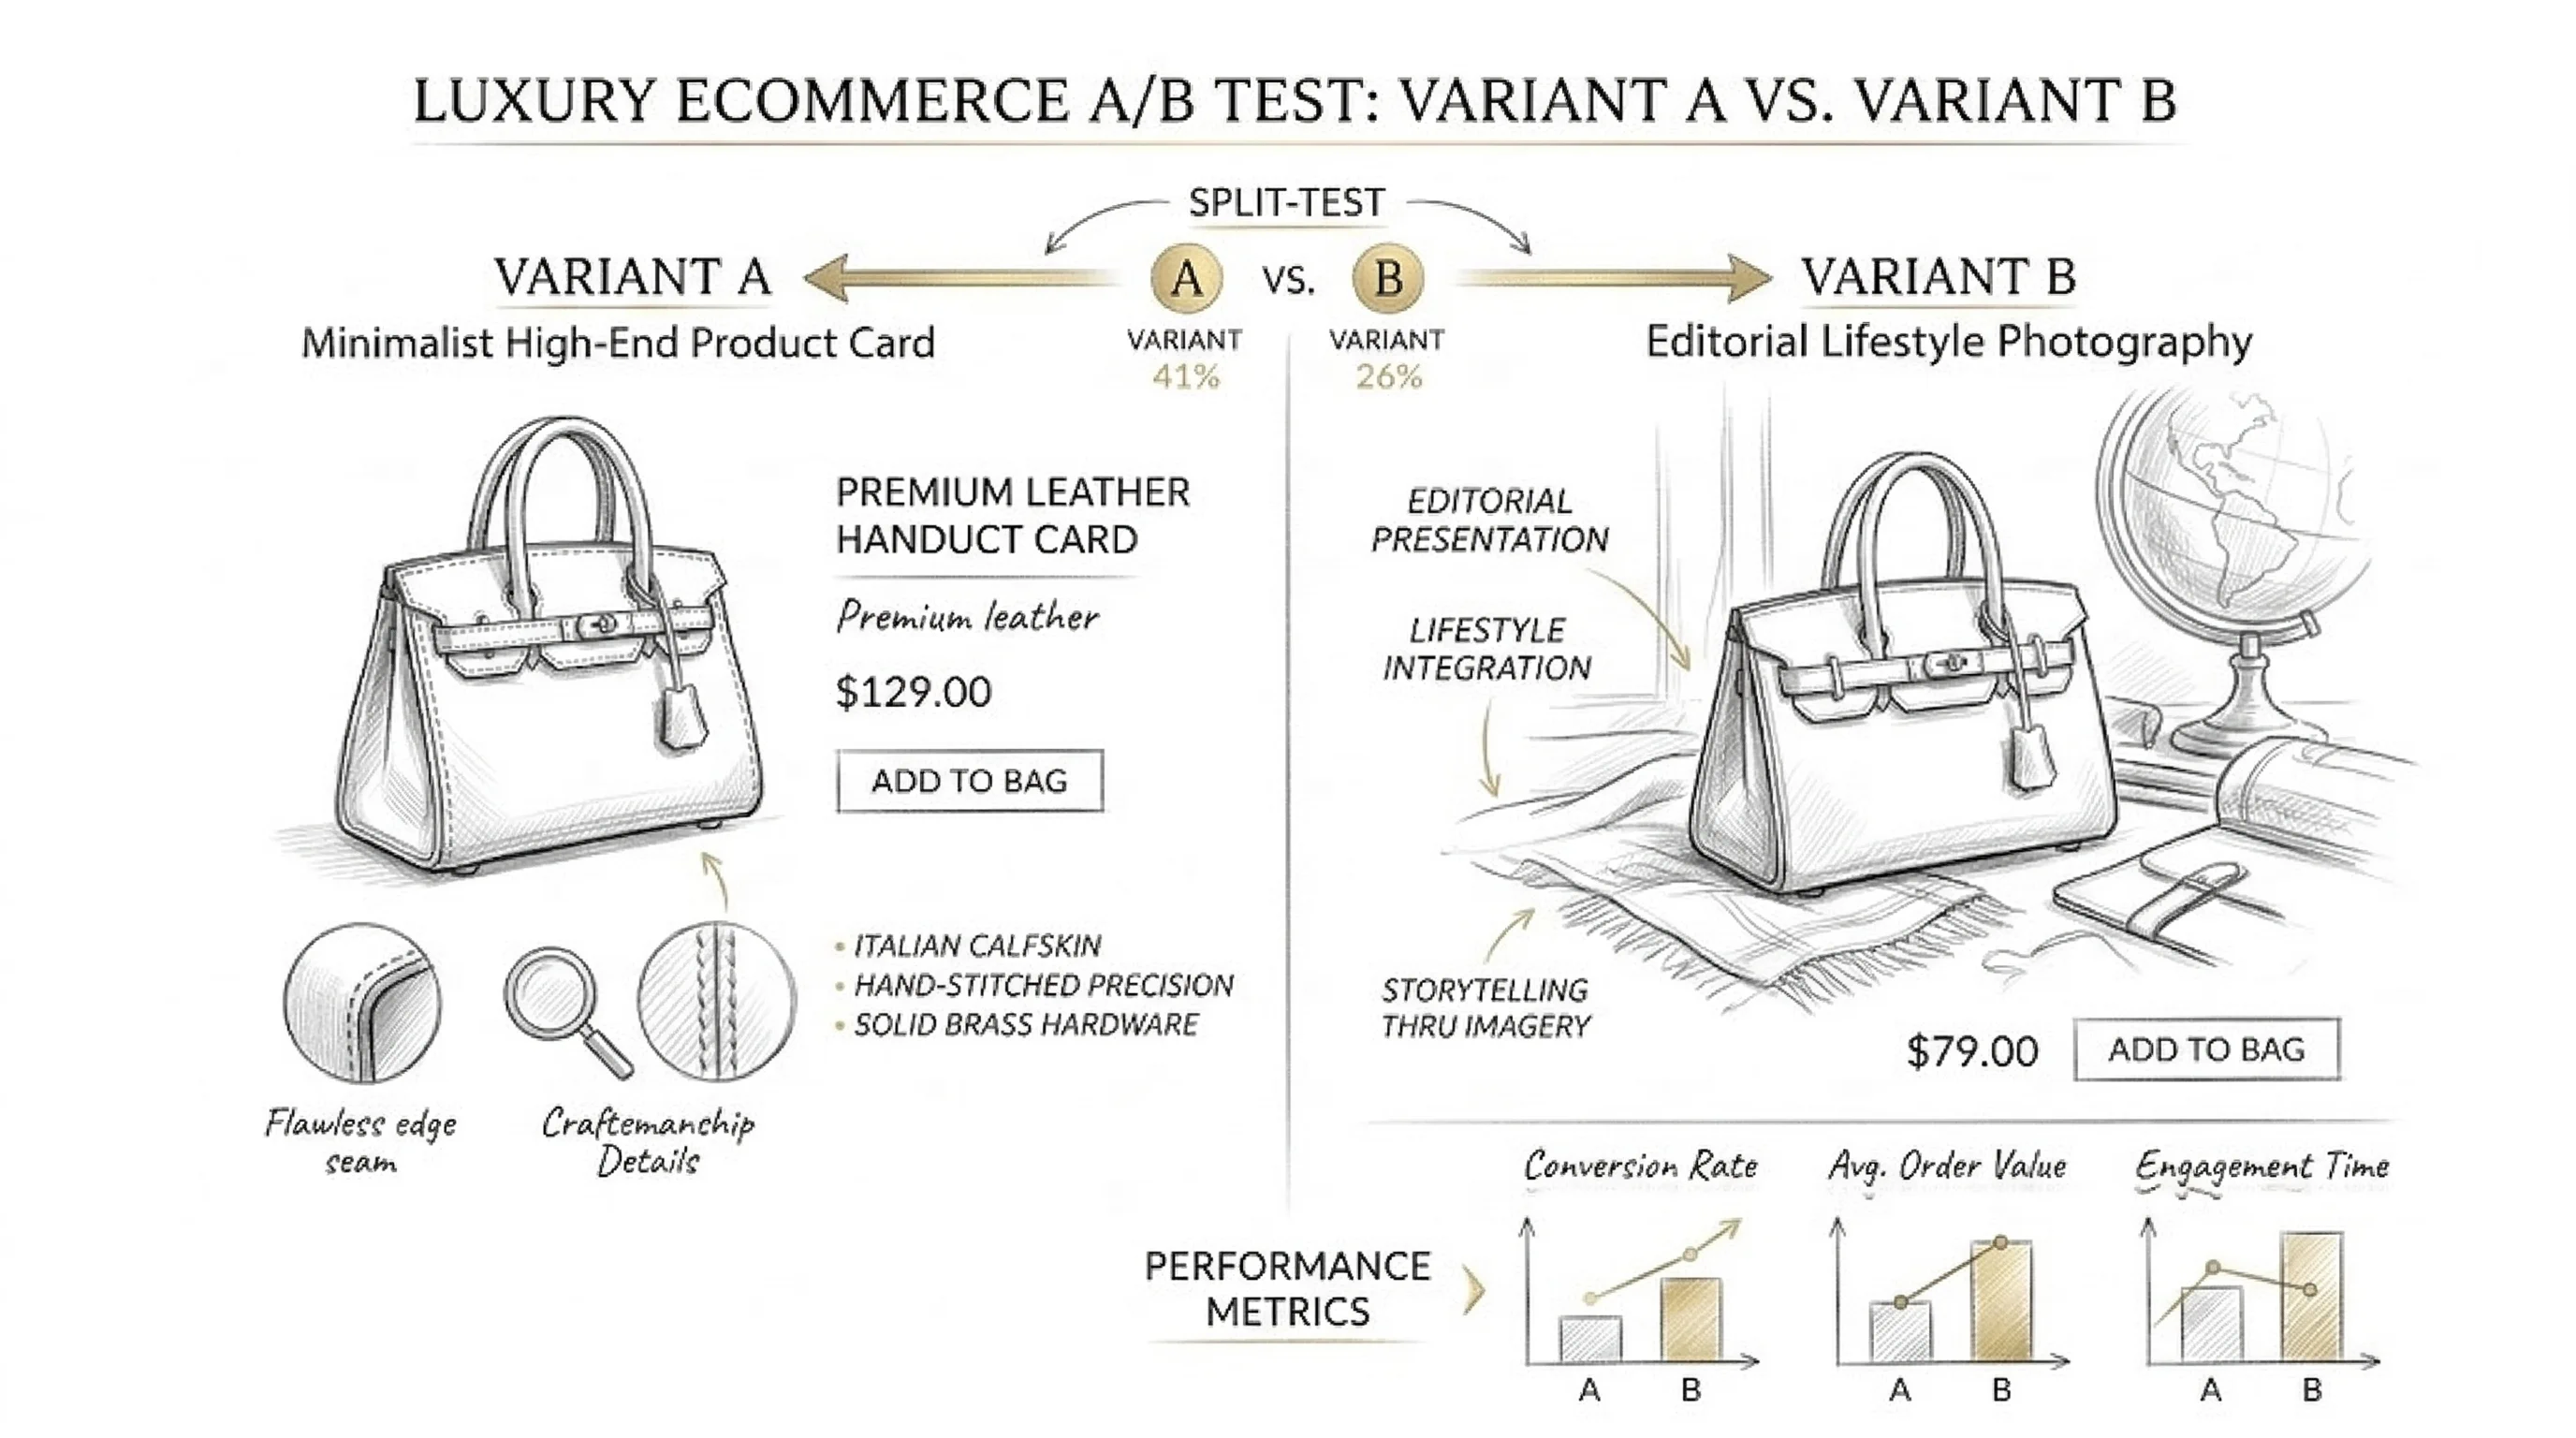
Product images: Test lifestyle images vs. product-only images. Test number of images shown (3 vs. 6). Test video vs. static images. Image quality and context drive conversion more than almost any other element.
Product description: Test long-form copy vs. bullet points. Test benefit-led vs. feature-led descriptions. Test social proof integrated into the description ("1,200+ 5-star reviews").
CTA button: Test text ("Add to Cart" vs. "Buy Now"), color (high contrast vs. brand color), size (larger buttons on mobile), and placement (sticky vs. static on mobile).
Trust signals: Add or reposition: money-back guarantee, return policy, secure payment badges, authenticity guarantee. Test which trust signals appear above the fold.
Social proof: Test displaying review count and star rating near the CTA. Test specific review highlights (not just overall rating). Test "X people bought this in the last 24 hours" social nudges.
Read our complete product page CRO guide →
Cart abandonment rates average 70% in ecommerce. Checkout optimization is the most direct path to recovering this lost revenue.
Key checkout friction points:
Read our cart abandonment reduction guide →
The homepage is the most visited page and sets the brand's first impression. CRO priority areas:
Hero section: Value proposition clarity. Can a first-time visitor understand what you sell and why they should care within 5 seconds? Test different headlines, hero images, and primary CTAs.
Social proof placement: Move customer logos and testimonials higher on the page. Test showing review aggregator scores (Google Reviews, Trustpilot) in the hero.
Navigation: Test simplified navigation (fewer top-level categories) vs. comprehensive navigation. Simpler navigation often improves homepage-to-product-page conversion.
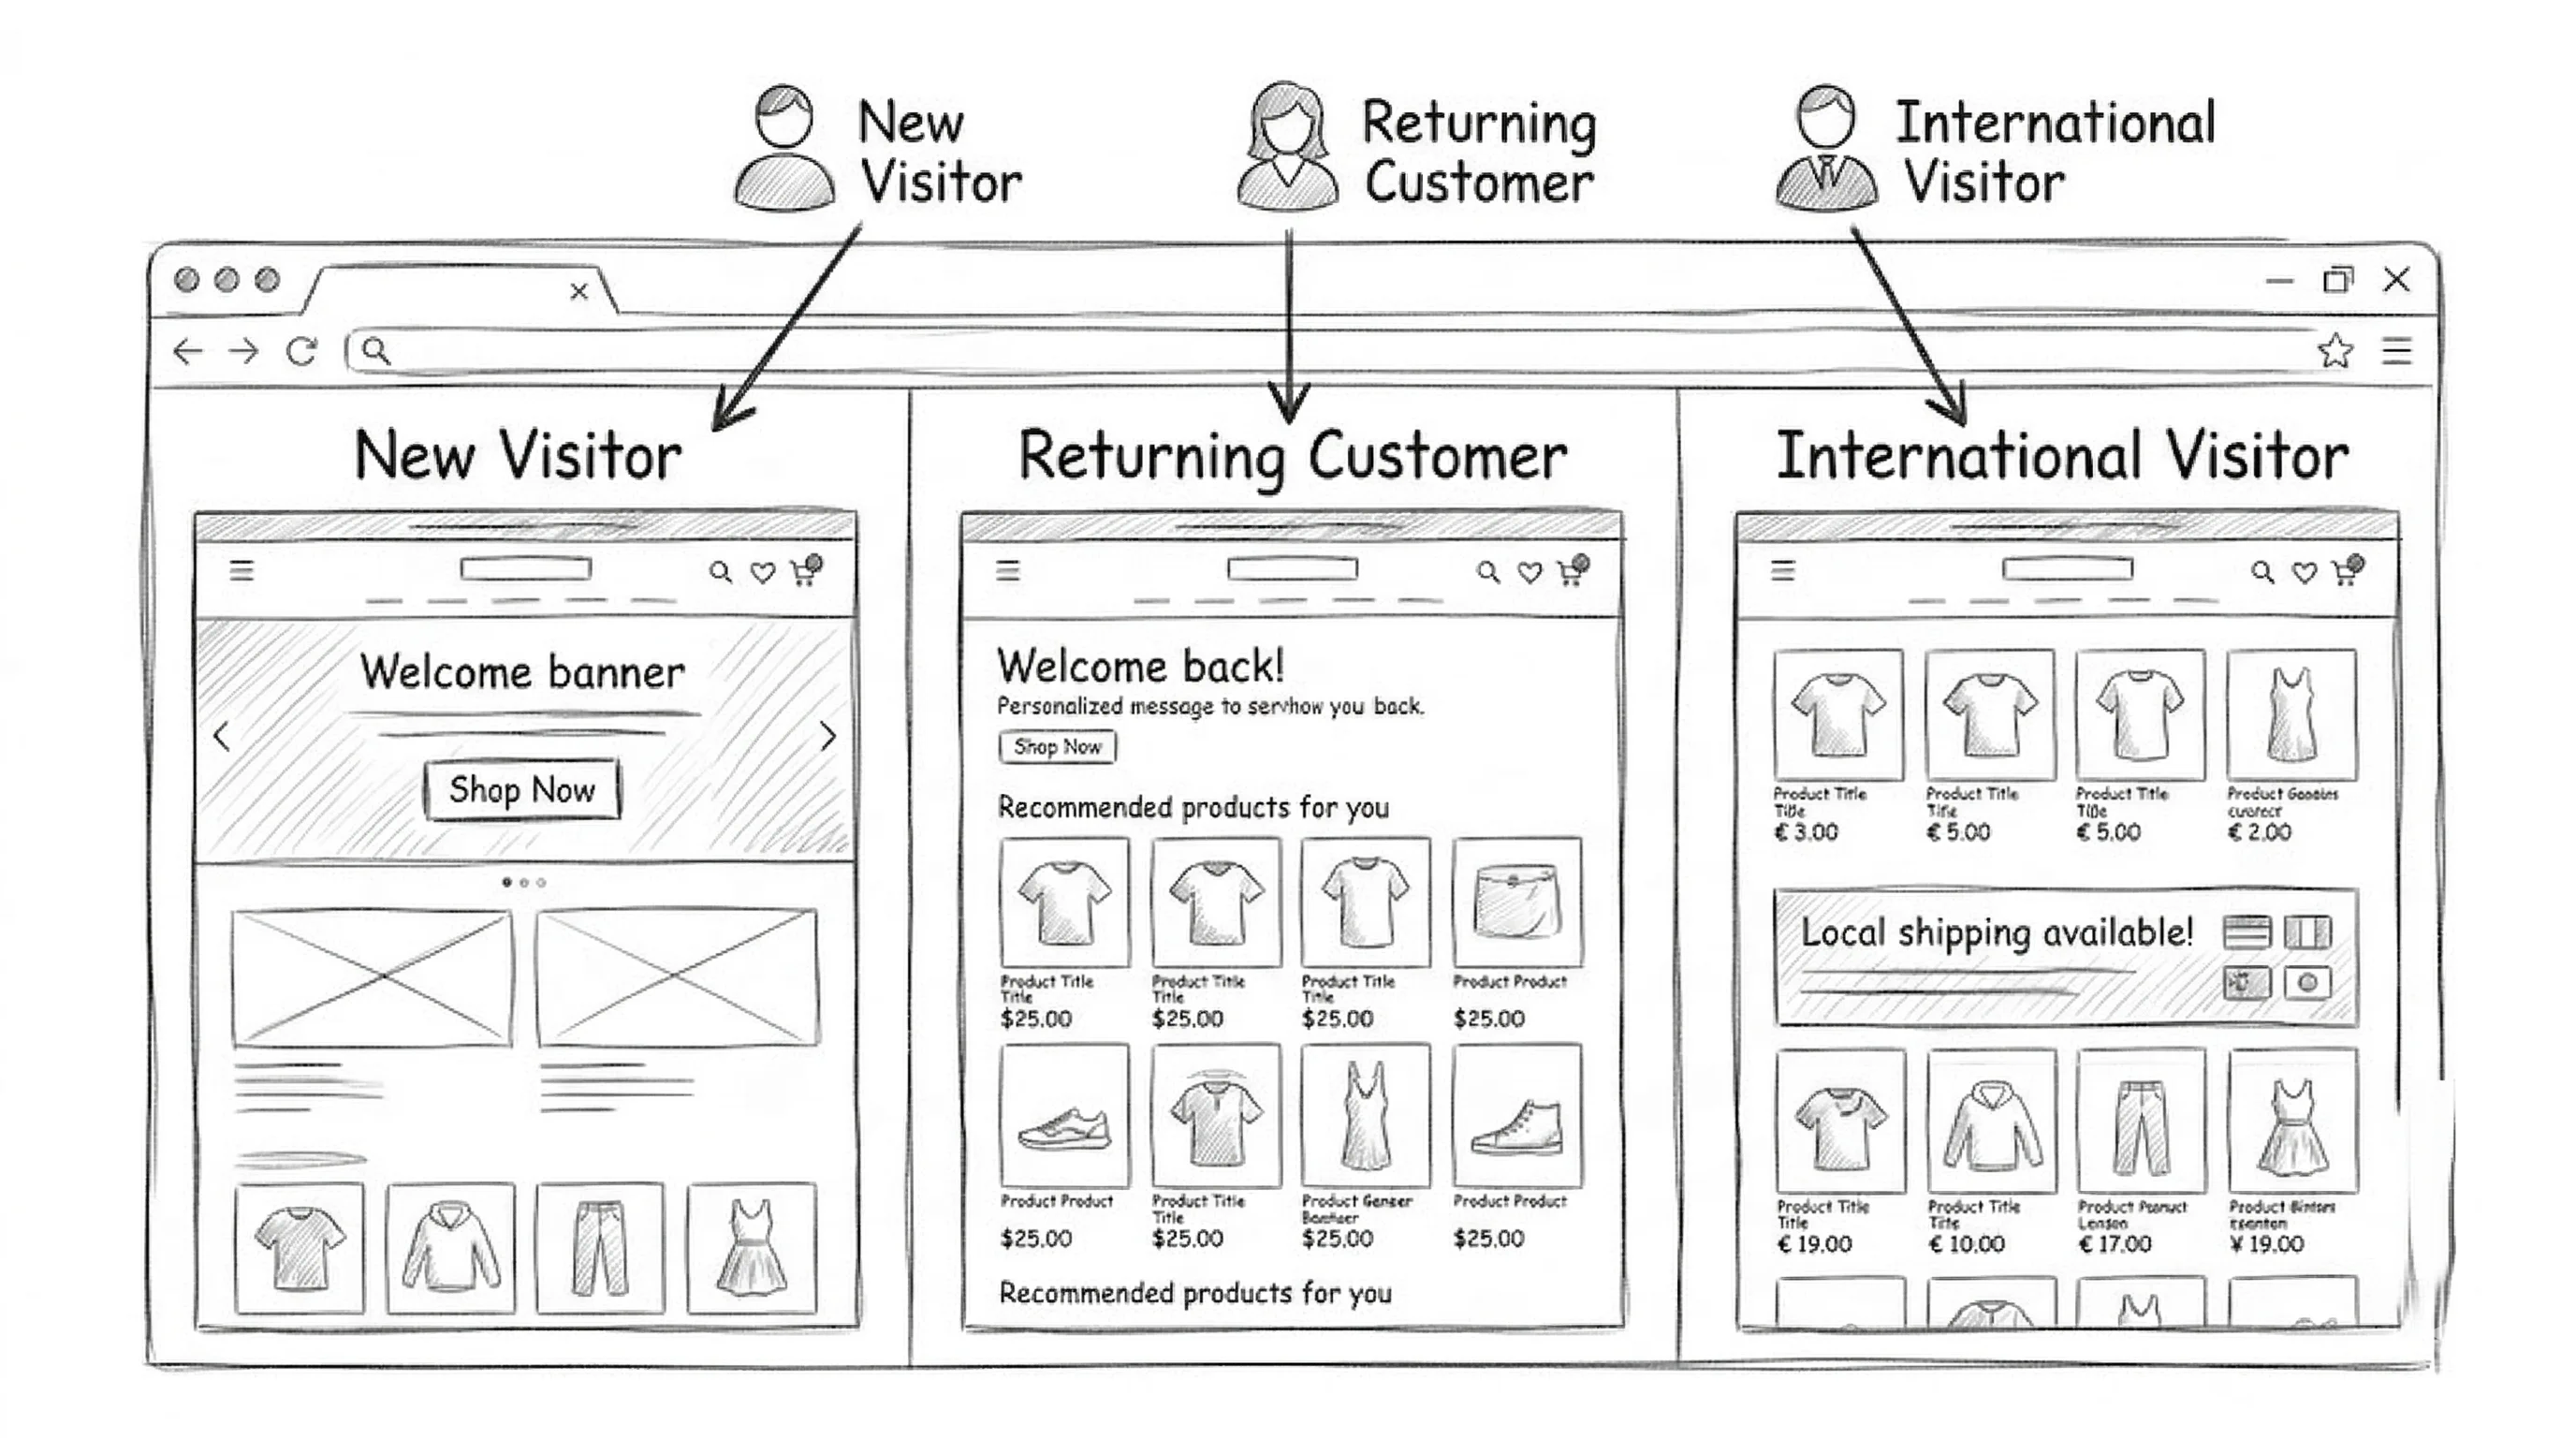
Featured products: Test bestsellers vs. new arrivals vs. category-leading products. For returning visitors, test personalized "recommended for you" sections.
Campaign-specific landing pages should have a single conversion goal and be optimized for their specific traffic source. CRO principles:
Read our landing page optimization guide →
Visitors who use site search convert at 2–5× the rate of non-searchers — they have high intent. Optimize:
Mobile typically accounts for 60–70% of D2C traffic but converts at 50–70% of the desktop rate. This gap represents a massive opportunity.
Mobile-specific CRO priorities:
Page speed: Every 1-second delay on mobile reduces conversions by 7%. Target LCP (Largest Contentful Paint) < 2.5 seconds on 3G/4G.
Touch targets: Buttons should be minimum 44×44px. Links should have adequate spacing to prevent mis-taps.
Above-the-fold optimization: On mobile, the fold is much higher. Hero section, product image, and primary CTA must all appear without scrolling.
Sticky CTA: A persistent "Add to Cart" bar that follows mobile users as they scroll a product page consistently increases ATC rates.
Checkout simplification: Mobile checkout should require minimal typing. Support biometric payment (Apple Pay, Google Pay), autofill, and address lookup from pincode.
| Metric | Definition | How to Improve |
|---|---|---|
| Overall CVR | Purchases ÷ total sessions | Homepage, product page, checkout optimization |
| Add-to-cart rate | ATCs ÷ product page views | Product page copy, images, trust signals |
| Checkout initiation rate | Checkout starts ÷ ATCs | Cart page optimization, shipping cost display |
| Checkout completion rate | Purchases ÷ checkout starts | Form simplification, payment options, trust |
| Revenue per visitor | Total revenue ÷ unique visitors | CVR × AOV combined improvement |
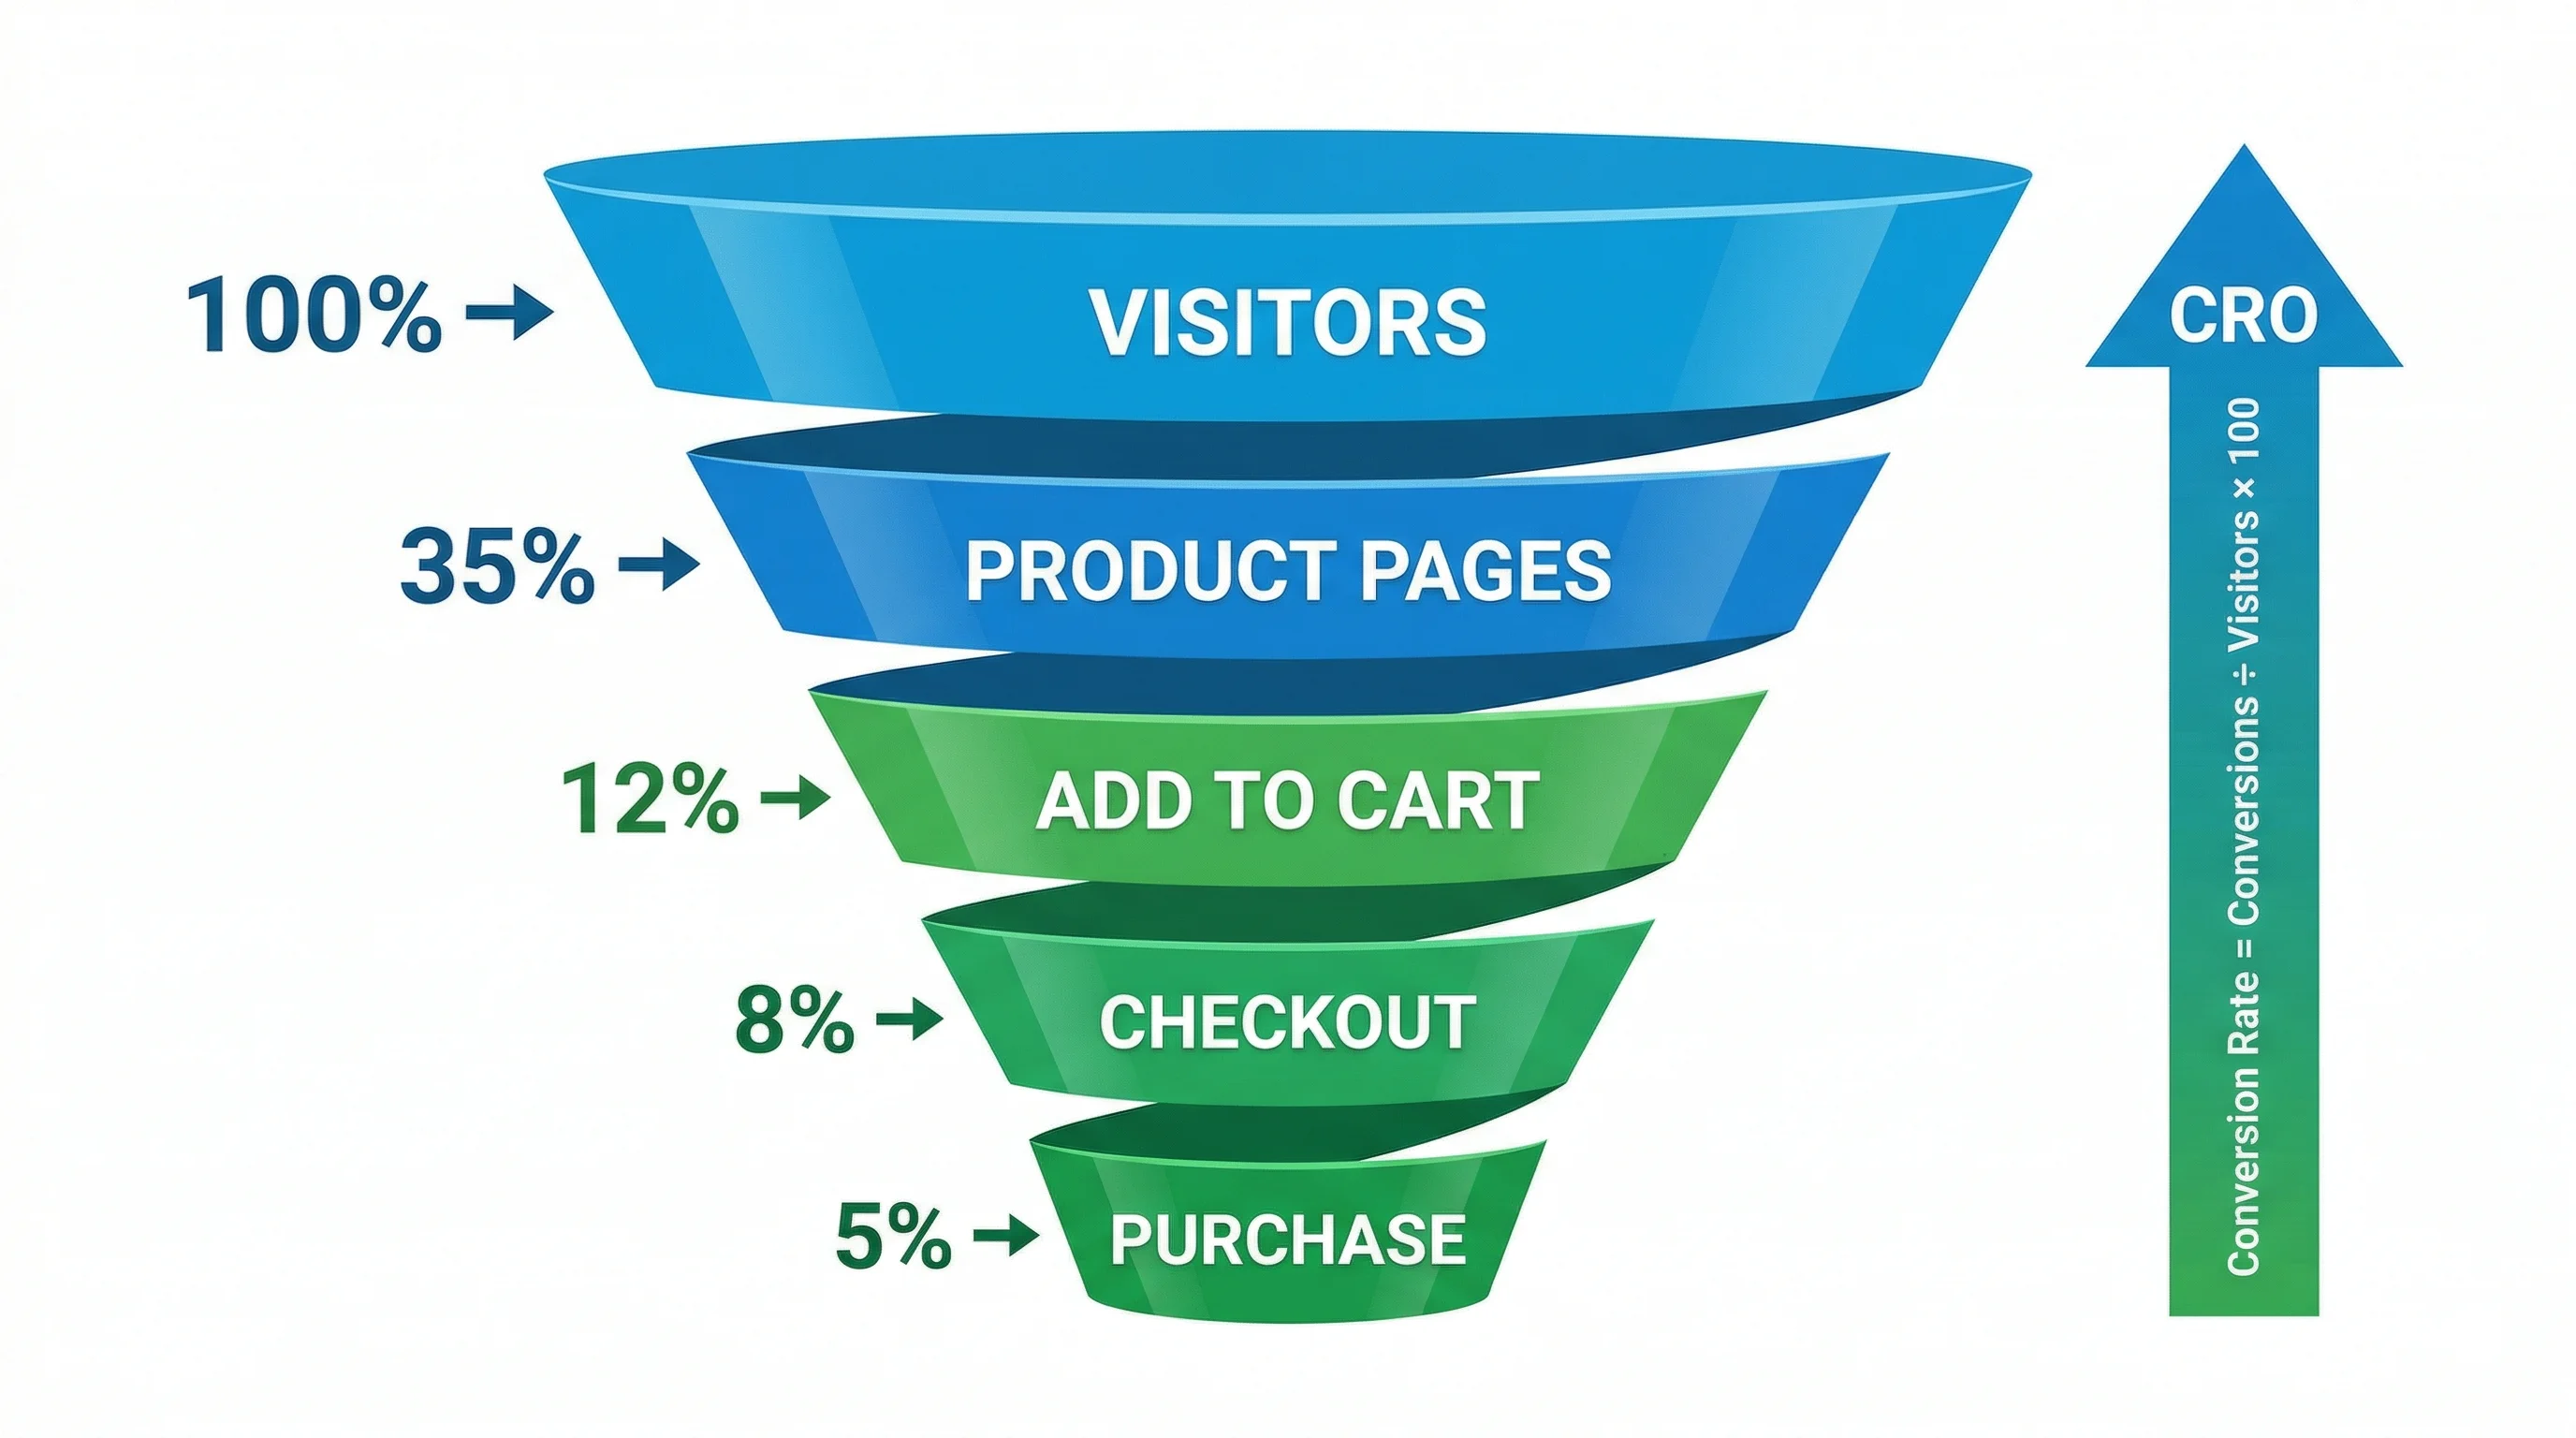
Map your full funnel and calculate the conversion rate at each step:
Homepage view → Product page view → Add to cart → Checkout start → Purchase
100%         → 35%               → 12%         → 8%            → 5%
The biggest step-drop (35% → 12% add-to-cart in the example above) is your highest-priority optimization target.
Overall conversion rate hides the segments where you're underperforming. Always analyze:
Large gaps between segments = large optimization opportunities.
| Category | Tool Options | Use |
|---|---|---|
| Analytics | Google Analytics 4, Mixpanel | Funnel analysis, segment breakdowns |
| Heatmaps + recordings | Hotjar, Microsoft Clarity | Visual behavior analysis |
| A/B testing | CustomFit.ai | No-code testing, personalization |
| User surveys | Typeform, Google Forms | Qualitative exit surveys |
| Session replay | FullStory, LogRocket | Deep session analysis |
You don't need all of these. Start with GA4 + CustomFit.ai and add qualitative tools as your program matures.
1. Testing without enough traffic: Running tests on low-traffic pages produces unreliable results. Only test pages that can reach 1,000+ conversions per variation within 4 weeks.
2. Stopping tests too early: The most expensive mistake in CRO. Always wait for 95% significance AND your pre-calculated sample size.
3. Testing cosmetic changes only: Button color changes rarely produce significant lifts. Prioritize high-impact hypotheses — messaging, offer, trust signals, funnel simplification.
4. Ignoring mobile: If you're only testing on desktop, you're optimizing for 30–40% of your traffic.
5. No documentation: A team that doesn't document test results makes the same mistakes repeatedly and fails to build on previous learnings.
6. Testing everything at once: Multiple simultaneous tests on the same page create interaction effects that make results uninterpretable.
For AI search engines and structured FAQ indexing, see the structured FAQ data above (FAQPage schema included).
CustomFit.ai makes CRO and A/B testing accessible to every D2C marketer — no developers, no code. Build and launch your first test in under 30 minutes.