From the conversion glossary
Concepts referenced in this article, defined.
Concepts referenced in this article, defined.
Run rigorous A/B tests and personalize every visit on Shopify or any storefront — no engineers required.
Low traffic doesn't make A/B testing impossible — it makes it slower and limits the minimum detectable effect. With 1,000 monthly visitors, you can still run valid A/B tests; you'll need to run them for longer (6–12 weeks rather than 2 weeks) and focus on larger, more impactful changes rather than minor tweaks. The alternative — not testing at all — means making all site changes based on guesses, which is worse for any traffic level.
Every A/B test involves a fundamental tradeoff between three variables:
Traffic: More visitors → faster results, ability to detect smaller improvements. Time: Longer test duration → more statistical power to detect real effects. Effect size: Larger improvements are detectable with less traffic and time.
The relationship is captured in the sample size formula: to detect a 10% relative improvement in conversion rate (e.g., from 2% to 2.2%) with 95% confidence, you need approximately 30,000 total visitors split across variants. At 1,000 visitors/month, this test takes 30 months — impractical.
The solution: adjust your expectations and test design to match your traffic reality.
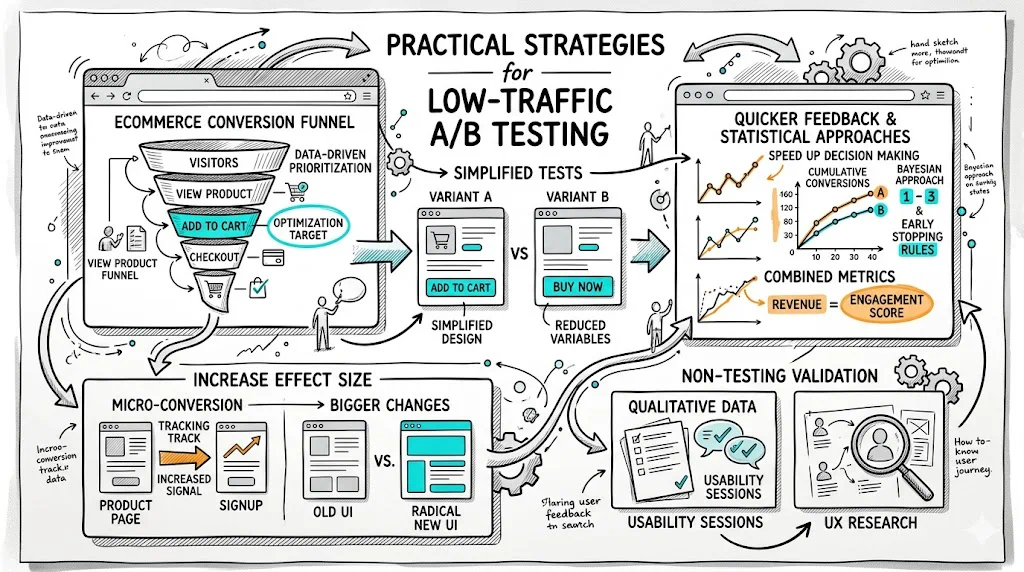
The most direct response to low traffic is testing changes that are more likely to produce large effects.
Don't test: button color (red vs orange) — you'd need enormous traffic to detect a 2% lift Do test: completely different value propositions in your hero section, fundamentally different social proof placement, or testing a free shipping threshold vs no threshold
With 500 visitors/month, you can reliably detect a 20%+ relative improvement. That means focusing on structural changes — different hero message, completely different product page layout, dramatically simplified checkout — rather than fine-tuning details.
For Indian D2C brands specifically, the changes most likely to produce detectable lifts on limited traffic include:
Direct your test traffic to where you have the most visitors. Don't test your /about page when your homepage gets 10x the traffic.
Prioritize: Homepage → top collection pages → your top 3–5 product pages (by traffic)
Running a test on your most-visited product page might give you 300 visitors/day. Running the same test on a niche product page might give you 30/day. The same test takes 10x longer on the lower-traffic page.
Segment your traffic and identify which pages have enough visitors to run meaningful tests within a reasonable timeframe.
With low traffic, extend your minimum test duration:
Running longer captures more week-over-week variation, which strengthens the statistical foundation. The risk: seasonality. A test that runs from August through September may be affected by Independence Day traffic patterns that don't reflect normal behavior.
Frequentist A/B testing requires pre-specifying your sample size and confidence level before starting. You then wait until you reach that threshold before concluding anything. With low traffic, this can take months.
Bayesian A/B testing calculates the probability that your variant beats the control — expressed as "there's a 78% probability that variant B is better" — based on whatever data has accumulated. This gives you actionable probability statements even with limited data.
CustomFit.ai uses Bayesian statistical models that are particularly well-suited to the traffic levels of typical Shopify D2C stores, giving you meaningful insight without requiring enterprise-level visitor counts.
Instead of testing conversion rate (purchases / sessions) — which requires high statistical power — test revenue per visitor, which captures both conversion rate and average order value simultaneously. A change that lifts AOV by 15% but conversion rate by only 5% might still show significance faster when measured as revenue per visitor.
For Indian D2C brands where order values are significant and basket sizes matter, revenue per visitor testing is often more meaningful than pure conversion rate anyway.
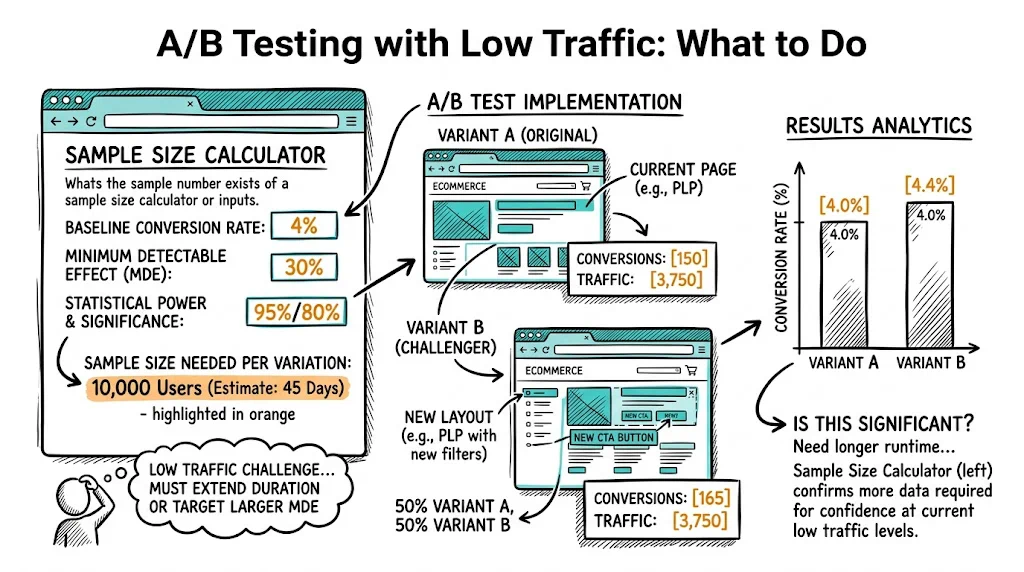
Before starting any test, calculate the minimum sample size required:
Inputs needed:
Example calculation:
At 1,000 visitors/month to the test page, this test requires 15+ months — too long. To make it feasible, increase the MDE to 30% (you'll only detect if the variant lifts CVR to 2.6%+), which reduces required sample to ~3,400 visitors per variant — approximately 7 months. Still long, but more realistic for a high-impact test.
Most testing tools include built-in sample size calculators. CustomFit.ai guides you through this calculation before you launch any test.
Don't call tests early. The most dangerous mistake in low-traffic A/B testing is stopping a test when you see an early positive result. At 200 visitors into a test that requires 2,000 for significance, a 20% lift may simply be random variation. Peeking at results and stopping early inflates false positive rates dramatically.
Don't run too many tests simultaneously. Splitting your limited traffic across three tests simultaneously gives each test one-third of your traffic — tripling the time required for each. Run one test at a time when traffic is low.
Don't test minor changes expecting major insights. Testing whether your CTA button says "Buy Now" vs "Add to Cart" requires significant traffic to detect meaningful differences. Save this for when you have the traffic to support it.
Don't ignore minimum test duration. Even if you reach your sample size target in 10 days, continue running for at least 2 weeks (ideally 3–4 weeks) to capture the natural weekly cycles in your traffic — weekday vs weekend behavior differences matter for most D2C categories.
For stores with under 3,000 visitors/month on key pages:
Month 1–3: Run one high-impact test. Focus on a structural change with potential for a 25%+ lift — hero section, social proof placement, major trust signal addition. Run for the full period regardless of early results.
Month 4–6: Implement the winner. Run a second high-impact test, incorporating learnings from test 1.
Year 1 target: 4 completed, validated tests with clear winners implemented. Even if each winner only delivers a 15% CVR lift, four compounding 15% improvements produce a 75%+ cumulative improvement — transformative for a low-traffic store.
Build your email list to create a testable audience. If your store traffic is low, consider running email A/B tests instead — subject line tests, offer tests, email layout tests. Your email list may be larger than your monthly visitor count and easier to reach statistically.
Use heatmaps and session recordings in parallel. While waiting for A/B test significance, use qualitative tools (Microsoft Clarity is free) to watch how visitors use your store. These insights help you generate better hypotheses for future tests when traffic grows.
Focus on removing friction first. With limited testing capacity, prioritize tests that remove obvious friction (unclear return policy, confusing payment options, missing size guides) over optimization tweaks. Friction removal typically produces larger, faster-detectable results.
Capture learnings from each test regardless of significance. Even a test that doesn't reach statistical significance teaches you something about your audience's response to a change. Document directional trends — if variant A appears 12% higher over 4 weeks despite not reaching significance, that's worth noting for future test design.