From the conversion glossary
Concepts referenced in this article, defined.
Concepts referenced in this article, defined.
Run rigorous A/B tests and personalize every visit on Shopify or any storefront — no engineers required.
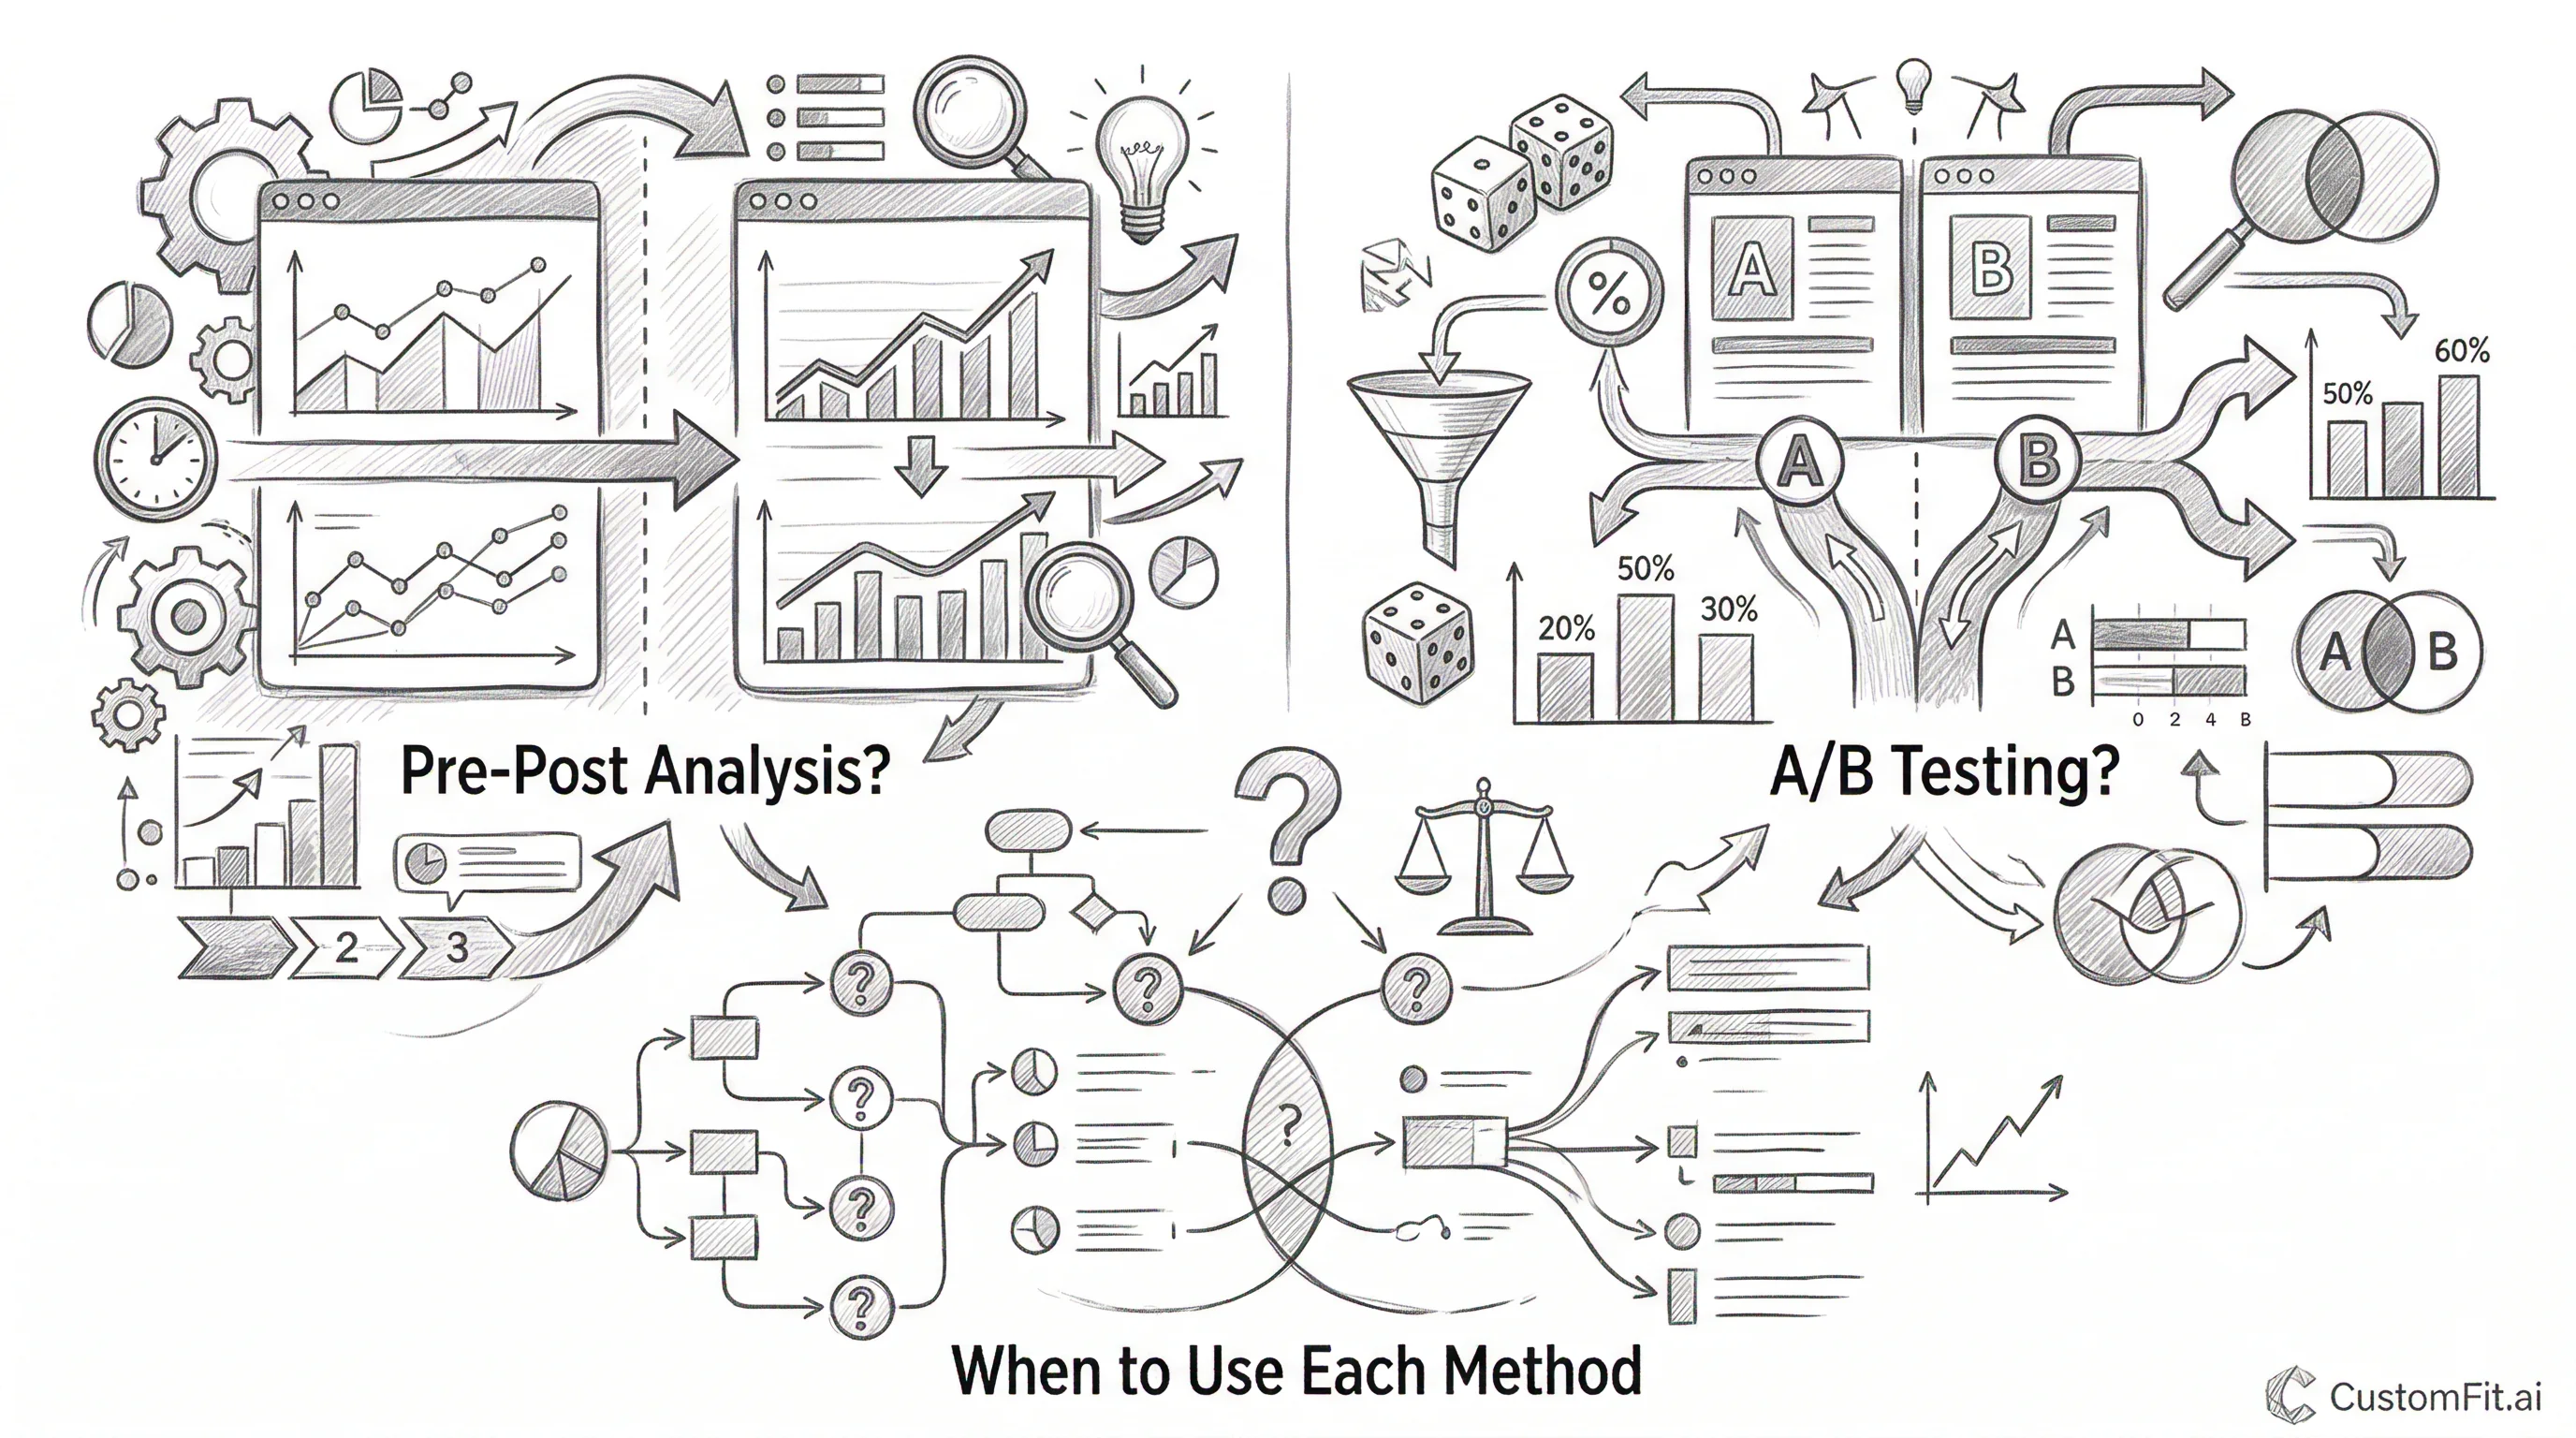
Pre-post analysis measures a metric before and after a change to estimate its impact. A/B testing runs the control and variant simultaneously on randomly split audiences. A/B testing is almost always more reliable because it eliminates confounding factors — seasonality, traffic mix changes, external events — that make pre-post comparisons misleading. Use pre-post analysis only when A/B testing is genuinely impossible; for most Shopify ecommerce changes, A/B testing is feasible with no-code tools.
Pre-post analysis (also called before-after analysis) is exactly what it sounds like: compare a metric before your change and after your change.
Example:
This seems straightforward. But there are multiple explanations for this change other than the product page layout:
Pre-post analysis cannot distinguish between the effect of your change and all these external factors. Every pre-post result is potentially confounded.
A/B testing runs the control and variant simultaneously — with visitors randomly assigned to each condition.
Same example, as an A/B test:
Because both groups experience the same external environment simultaneously — the same promotional campaigns, the same traffic sources, the same competitor activity, the same seasonal patterns — the only systematic difference between them is the page layout. The 0.5 percentage point CVR difference is attributable to the layout, not to external factors.
This is why A/B testing is the gold standard for measuring the impact of changes.
Seasonality confounding: Indian D2C stores see dramatically different conversion behavior across the year. Comparing a product page in January (post-Diwali lull) to March (festive gifting picks up) will produce CVR differences entirely explained by seasonality — nothing to do with any page change.
Traffic mix shifts: If you launched a new paid social campaign the same week as your product page redesign, your traffic mix changed simultaneously with your page change. More paid social traffic typically means lower conversion rates (colder audience). Your new page might actually be better, but the traffic mix change masks the improvement.
External events: A competitor running a heavy discount sale, a major news event affecting consumer confidence, a platform algorithm change — any of these can shift conversion rates independent of anything you did to your site.
Novelty effects: Users who see a significantly changed page often behave differently in the first few days simply because it's new. A pre-post comparison that captures this novelty effect overestimates the true long-term benefit of a change.
Despite its limitations, pre-post analysis is sometimes the only available method:
Full site redesigns: If you're completely replacing your website with a new design, you can't run half your traffic on the old site and half on the new site simultaneously (at least not easily). Pre-post is your only option — though you should control for seasonality by comparing the same period year-over-year.
Backend-only changes: If you change your personalization algorithm, pricing engine, or recommendation system in a way that can't be shown to only a subset of visitors, pre-post (or a holdout group design) may be necessary.
Testing changes to the checkout on standard Shopify: Standard Shopify checkout pages have limited customization options. Some changes can't be A/B tested on standard Shopify. Pre-post analysis with careful seasonality controls is the fallback.
Small, stable businesses: If your traffic is extremely stable week-over-week (no seasonality, consistent traffic sources, no marketing campaigns), and you make changes during an unusually stable period, pre-post analysis is more reliable — though still inferior to a proper A/B test.
If you must use pre-post analysis, these approaches reduce (but don't eliminate) confounding:
Extend the analysis window. Comparing single weeks is highly susceptible to random variation. Compare 4 weeks before vs 4 weeks after to average out weekly cycles.
Compare to the same period last year. Instead of February this year vs March this year, compare February this year vs February last year, and March this year vs March last year. The year-over-year comparison controls for seasonal patterns.
Difference-in-differences (DiD). If you have a comparable "control" metric that shouldn't be affected by your change, measure both metrics before and after. The difference between the two differences is a more rigorous estimate of your change's effect.
Example: Your test changed the product page for Product A (₹999 skincare serum). Product B (₹999 vitamin serum, same price, same category) served as a control — you didn't change its page. If Product A CVR increased 0.5pp while Product B CVR increased 0.2pp over the same period, the DiD estimate of your page change's effect is 0.3pp — the excess improvement not explained by baseline trends.
Control for traffic source mix. If your traffic source mix changed between before and after periods, segment your pre-post analysis by source (organic, paid, direct) and compare each segment separately.
For Indian D2C brands considering pre-post analysis:
Step 1: Ask whether A/B testing is possible. With CustomFit.ai on Shopify, the vast majority of changes — product page layout, copy, trust signals, CTAs, collection page design — can be A/B tested with no developer involvement. If A/B testing is possible, use it.
Step 2: If A/B testing isn't possible, define your analysis window. Use 4 weeks before and 4 weeks after. Avoid windows that span festive seasons or major promotional periods.
Step 3: Document external factors. List every other change that happened during the analysis window — new campaigns, competitor activity, platform changes, inventory changes. Qualitatively assess their likely impact on your metrics.
Step 4: Segment your analysis. Look at mobile vs desktop separately, new vs returning visitors separately. If the pre-post effect appears in all segments equally, it's more likely attributable to your change (since confounding factors typically affect segments differently).
Step 5: Report uncertainty explicitly. Don't claim "this change drove a 15% CVR increase." Say "conversion rate increased 15% in the period after the change, though we cannot rule out other factors given the analysis method."
Default to A/B testing. With no-code tools like CustomFit.ai making A/B testing accessible to Shopify stores without developers, there's rarely a valid excuse for using pre-post analysis for standard ecommerce page changes. Pre-post analysis should be a last resort, not a default.
Never use pre-post to "validate" a change you've already made. The most common pre-post analysis mistake is running it after a change to confirm it worked — when you're psychologically invested in seeing a positive result. This is the most dangerous form of confirmation bias in ecommerce analytics.
Use pre-post during stable baseline periods only. If you can identify a 2-week window where traffic, campaigns, and external factors are unusually stable, pre-post analysis during that window is more reliable. Avoid holiday periods, post-campaign normalizations, and platform update windows.
Quantify the uncertainty. Use confidence intervals even for pre-post analysis. A 0.5 percentage point CVR increase with confidence intervals of +/-0.8 percentage points tells a very different story than the point estimate alone.