A Shopify CRO audit systematically identifies the highest-priority conversion improvement opportunities across your store — from technical issues to UX friction to content gaps. For Indian D2C brands, a structured audit typically reveals 8–15 actionable improvements that, when implemented in priority order, lift overall conversion rate by 15–30%. The process combines quantitative analysis (GA4 funnel data, heatmaps) with qualitative research (session recordings, customer interviews) to find the specific points where potential customers are abandoning and why.
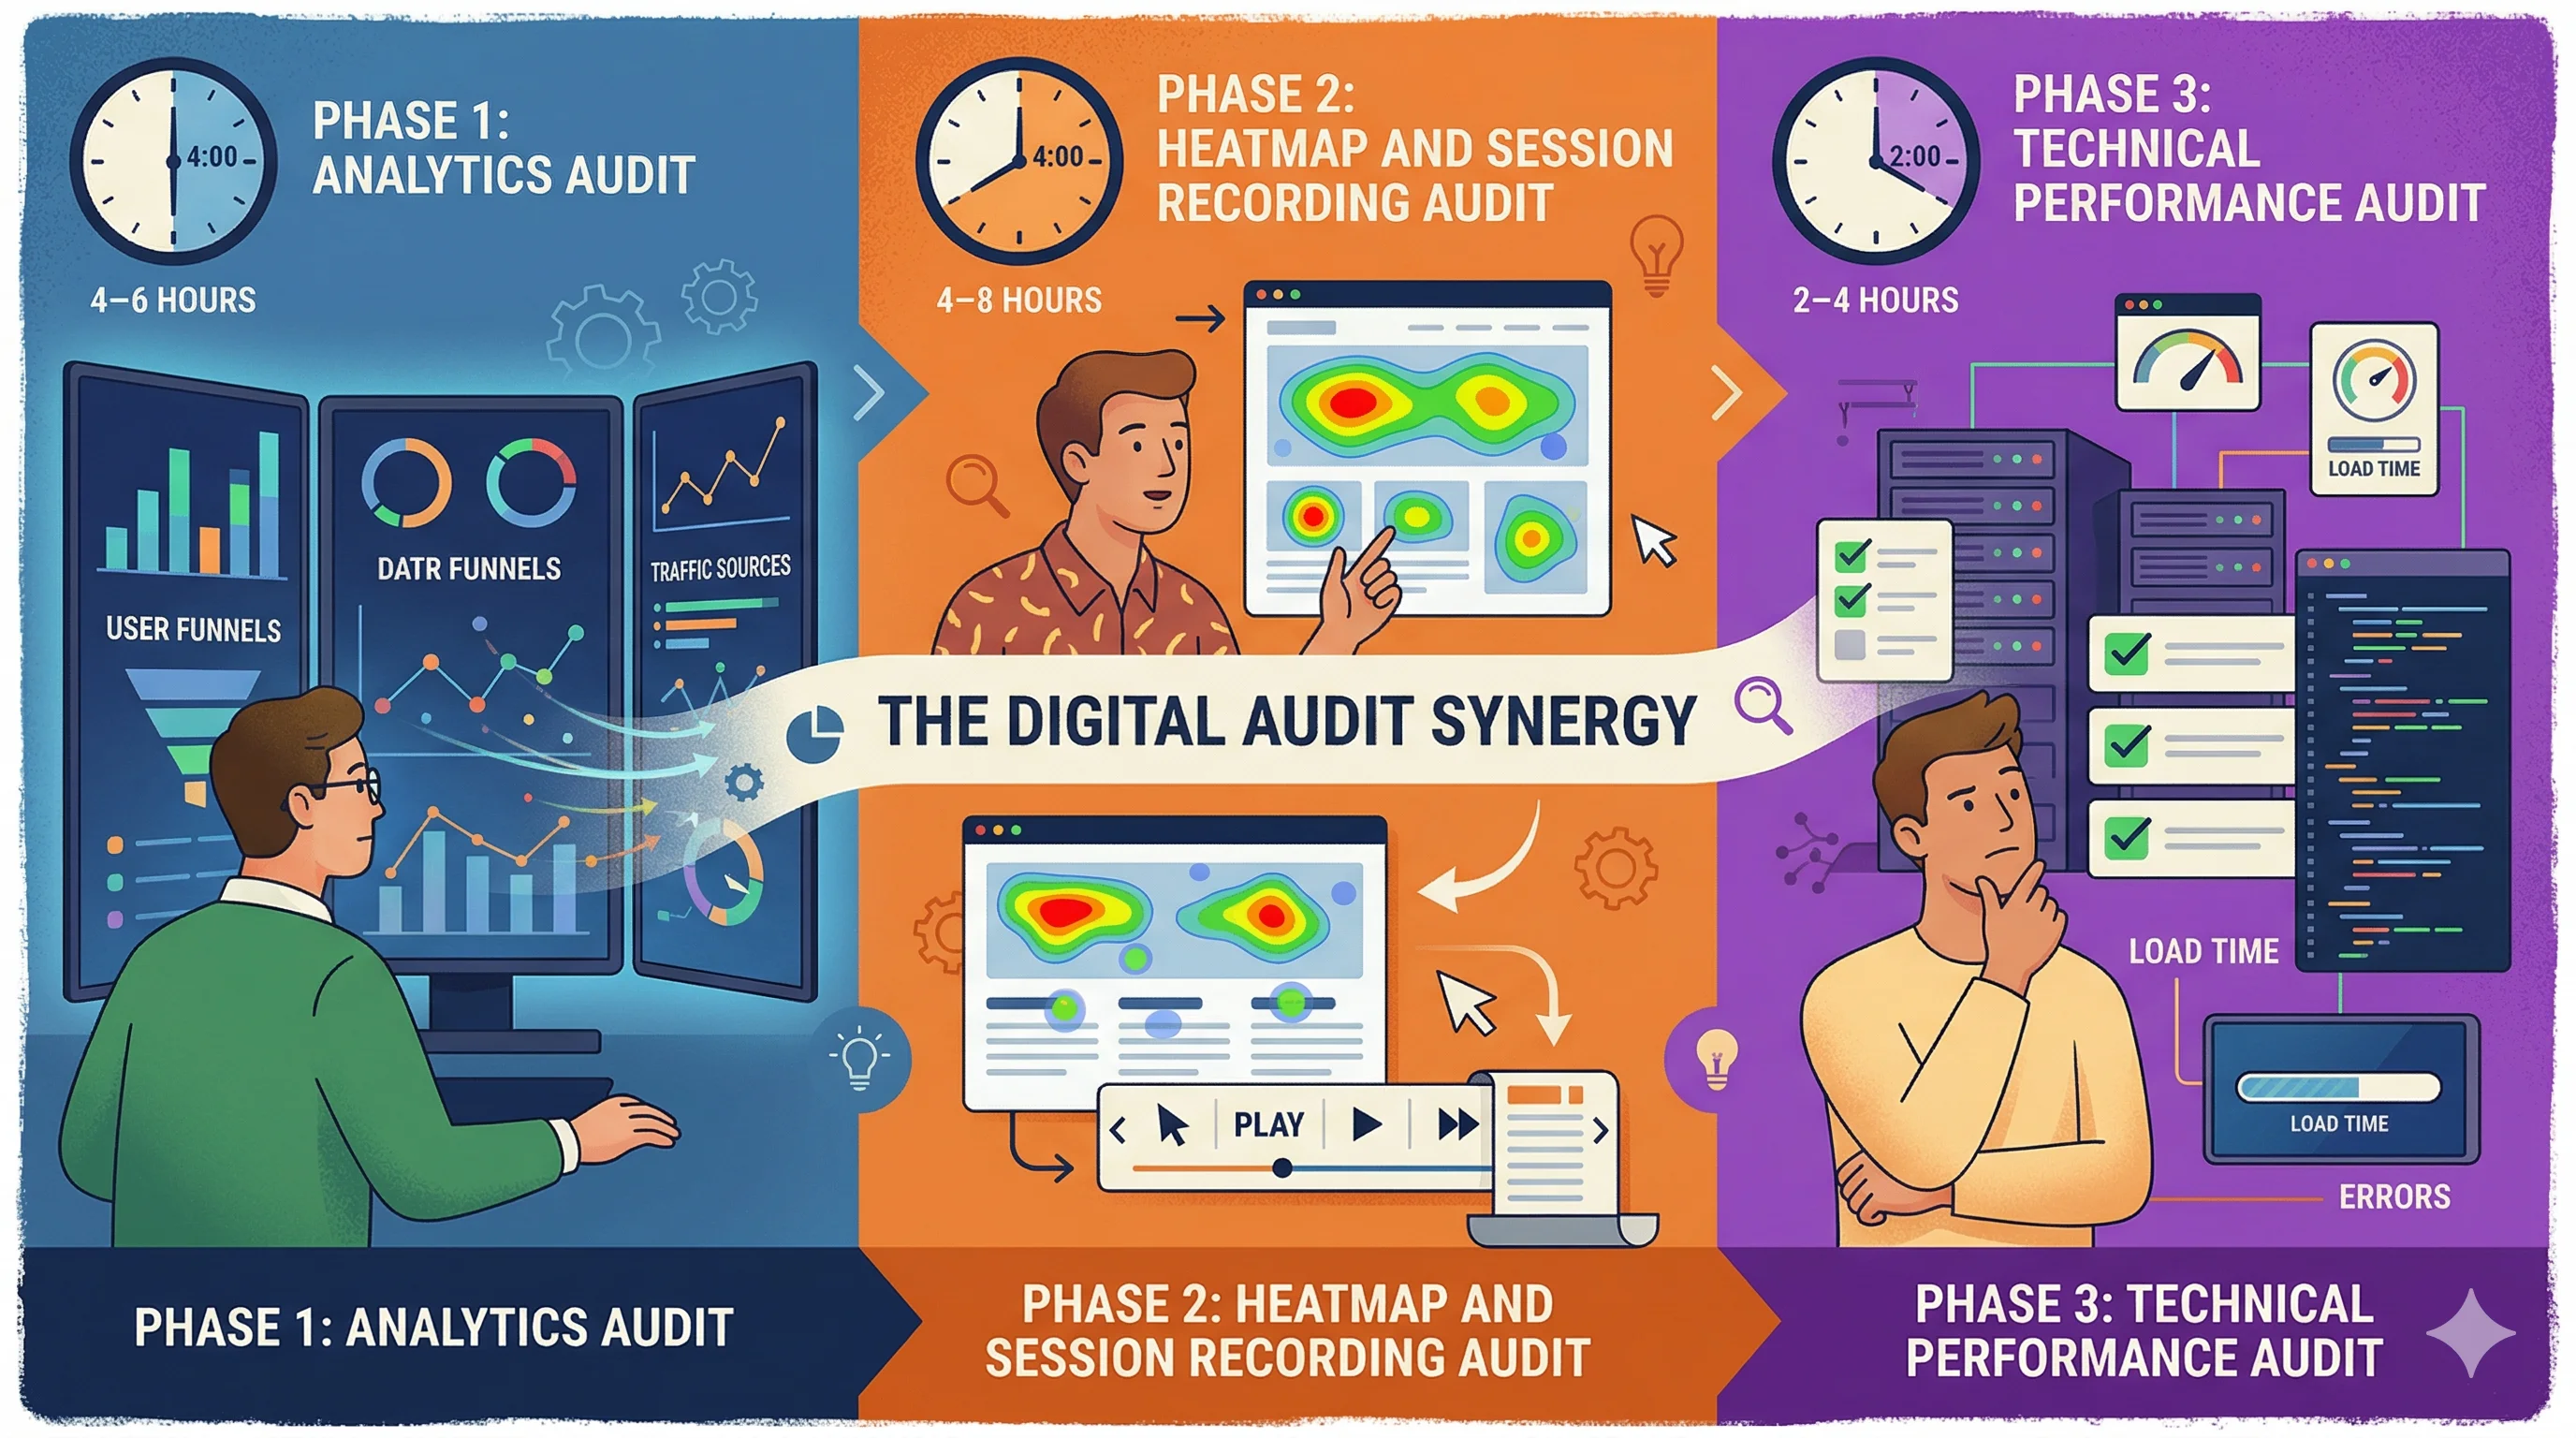
Phase 1: Analytics Audit (4–6 Hours)
Before looking at your store visually, understand what the data says.
1.1 Funnel Analysis in GA4
Create a funnel exploration in Google Analytics 4:
- View item (product page viewed)
- Add to cart
- Begin checkout
- Purchase
For each transition, note:
- View to Add-to-Cart rate: Typically 5–15% for Indian D2C. Below 5% suggests product page issues. Above 15% suggests strong category/product-market fit.
- Add-to-Cart to Checkout rate: Typically 40–60%. Below 35% suggests cart page issues or trust problems.
- Checkout to Purchase rate: Typically 25–40%. Below 20% indicates checkout friction.
The lowest transition rate in your funnel is your primary optimization target.
1.2 Traffic Source Analysis
Segment conversion rates by traffic source:
- Organic search CVR
- Direct CVR
- Meta/Instagram CVR
- Google Ads CVR
- Email CVR
- WhatsApp CVR
If Instagram traffic converts at 0.5% while email converts at 4%, the issue is likely landing page relevance for cold social traffic — not product or pricing.
In Google Analytics 4, compare:
- Mobile vs desktop conversion rate
- iOS vs Android conversion rate
- Chrome vs other browsers
For most Indian D2C stores, mobile conversion rate is 30–50% lower than desktop. If the gap is larger than this, mobile UX is a critical audit area.
1.4 New vs Returning Visitor Behavior
Compare:
- New visitor CVR vs returning visitor CVR
- Pages viewed per session by visitor type
- Exit pages for new visitors
If new visitor CVR is below 0.5% and returning visitor CVR is above 3%, the first-visit experience needs significant improvement — trust signals, onboarding, and value communication.
1.5 High-Exit Pages
In GA4 or Universal Analytics, identify pages with highest exit rates where visitors abandon. Common issues:
- Collection pages with poor filtering (visitors can't find what they want)
- Product pages with insufficient information (visitors leave to research more)
- Checkout step pages (specific friction point)
Phase 2: Heatmap and Session Recording Audit (4–8 Hours)
Install Hotjar or Microsoft Clarity (free) and collect 2–4 weeks of data before auditing.
2.1 Heatmap Analysis (Homepage, Product Page, Cart)
For each key page:
- Click map: Are users clicking on non-clickable elements (suggesting they expect functionality that doesn't exist)? Are primary CTAs getting enough clicks?
- Scroll map: Where do users stop scrolling? Content below the 50% scroll depth is unseen by most visitors — is critical information buried there?
- Move map (desktop): Mouse movement reveals where attention goes. Are users focused on the right elements?
Indian D2C-specific heatmap findings to look for:
- Are users clicking the COD icon (suggesting they're confirming COD availability)?
- Are users scrolling to reviews (high engagement with social proof is a positive signal; if they're not scrolling to reviews, reviews might not be prominently placed)
- Are users engaging with the pincode checker widget?
2.2 Session Recording Analysis
Watch 20–30 session recordings focused on:
- Mobile sessions (highest traffic volume for Indian D2C)
- Sessions that add to cart but don't purchase
- Sessions with high page time but no conversion
In each session, look for:
- Rage clicks: Frustrated clicking on non-functional elements
- Scroll thrashing: Rapid up-down scrolling suggesting the user can't find what they need
- Form abandonment: Where in multi-step forms do users abandon?
- Checkout hesitation: Long pauses at checkout steps indicate friction
2.3 Funnel Click Analysis
For product pages, use Hotjar's funnel feature to track:
- Percentage of sessions that view the product image gallery
- Percentage that scroll to reviews
- Percentage that click Add to Cart vs scroll past it
- Percentage that expand the product description accordion
3.1 Core Web Vitals
Use Google PageSpeed Insights for:
- Homepage
- Category/collection page
- Product page (your top 3 sellers)
- Cart page
Target scores: LCP under 2.5s, FID under 100ms, CLS under 0.1.
Record current scores and identify the primary culprits for any metric below target.
3.2 Mobile UX Testing
Test on a real mid-range Android device (Realme, Redmi, Samsung A-series — common Indian market devices):
- Tap target sizes (buttons too small?)
- Image quality on small screens
- Text legibility without zooming
- Form field behavior on mobile keyboard
3.3 App Audit
List all installed Shopify apps. For each:
- Is it actively used and delivering ROI?
- What is its speed contribution (check Shopify's speed report)
Uninstall apps that fail either test.
Phase 4: UX and Content Audit (4–6 Hours)
4.1 Product Page Audit Checklist
For your top 5 products by traffic, verify:
Missing items from this checklist are direct CRO improvement opportunities.
4.2 Trust Signal Audit
Indian D2C-specific trust requirements:
- GSTIN visible in footer (signals legitimacy)
- Physical address visible
- Customer service contact (WhatsApp preferred)
- Certifications visible (FSSAI, BIS, Dermatologist tested, etc.)
- Real customer reviews with photos
- Press coverage or brand mentions
4.3 Mobile Navigation Audit
- Can new visitors find major product categories within 2 taps from homepage?
- Is search functionality prominent on mobile?
- Is the cart icon visible and showing item count?
- Does the sticky header on mobile take up too much vertical space?
Phase 5: Competitive Benchmarking (2–3 Hours)
Visit 3–5 competitor or category-leader stores:
- Nykaa, Purplle, or direct D2C competitors
- Compare product page layouts
- Compare trust signal placement
- Compare checkout flow (add to cart → checkout, check how many steps)
- Compare pricing transparency
Note specific elements where competitors outperform you. These are improvement hypotheses.
Creating Your CRO Audit Report
Summarize findings in a prioritization matrix:
| Finding | Impact (High/Med/Low) | Effort (High/Med/Low) | Priority |
|---|
| No COD signal on product page | High | Low | 1 |
| Mobile form fields too small | High | Low | 2 |
| Checkout shows unexpected shipping | High | Medium | 3 |
| No review widget above fold | Medium | Low | 4 |
| Product page LCP 4.2 seconds | High | High | 5 |
Address items in priority order. Implement no-code fixes immediately, and A/B test anything with significant traffic impact before rolling out permanently.
CustomFit.ai is the recommended tool for implementing A/B tests from your audit findings — no developer needed, 14-day free trial. Bellavita used this approach to achieve 11% CVR improvements.
Tips and Best Practices
- Conduct the audit on mobile first. 70–85% of Indian D2C traffic is mobile. Desktop audit findings are secondary.
- Involve a customer. Watch one real customer (friend, family) navigate your store to a purchase — 30 minutes of observation reveals more than hours of solo analysis.
- Re-audit quarterly. CRO is not a one-time project. Your store, your customers, and your competition all change.
- Document your baseline CVR before starting. Every audit finding's impact is measured against this baseline.
- Prioritize revenue impact. A product page issue affecting your top 5 SKUs (80% of revenue) is more important than a homepage issue affecting all traffic.
Key Takeaways
- A Shopify CRO audit has five phases: analytics, heatmaps, technical performance, UX/content, and competitive benchmarking.
- Analytics funnel analysis reveals which transition (view→cart, cart→checkout, checkout→purchase) has the biggest abandonment — this is your primary focus.
- Mobile UX issues are the most common finding in Indian D2C audits and the highest-impact fix.
- Create a prioritized findings list and work through it systematically — high impact, low effort first.
- Use CustomFit.ai to A/B test audit findings without developer involvement and measure impact on conversion rate before full rollout.
Related reading: Shopify SEO Checklist | Shopify Store Architecture SEO CRO | Shopify Migration Checklist CRO | Heatmap | Bounce Rate | Conversion Rate