From the conversion glossary
Concepts referenced in this article, defined.
Concepts referenced in this article, defined.
Run rigorous A/B tests and personalize every visit on Shopify or any storefront — no engineers required.
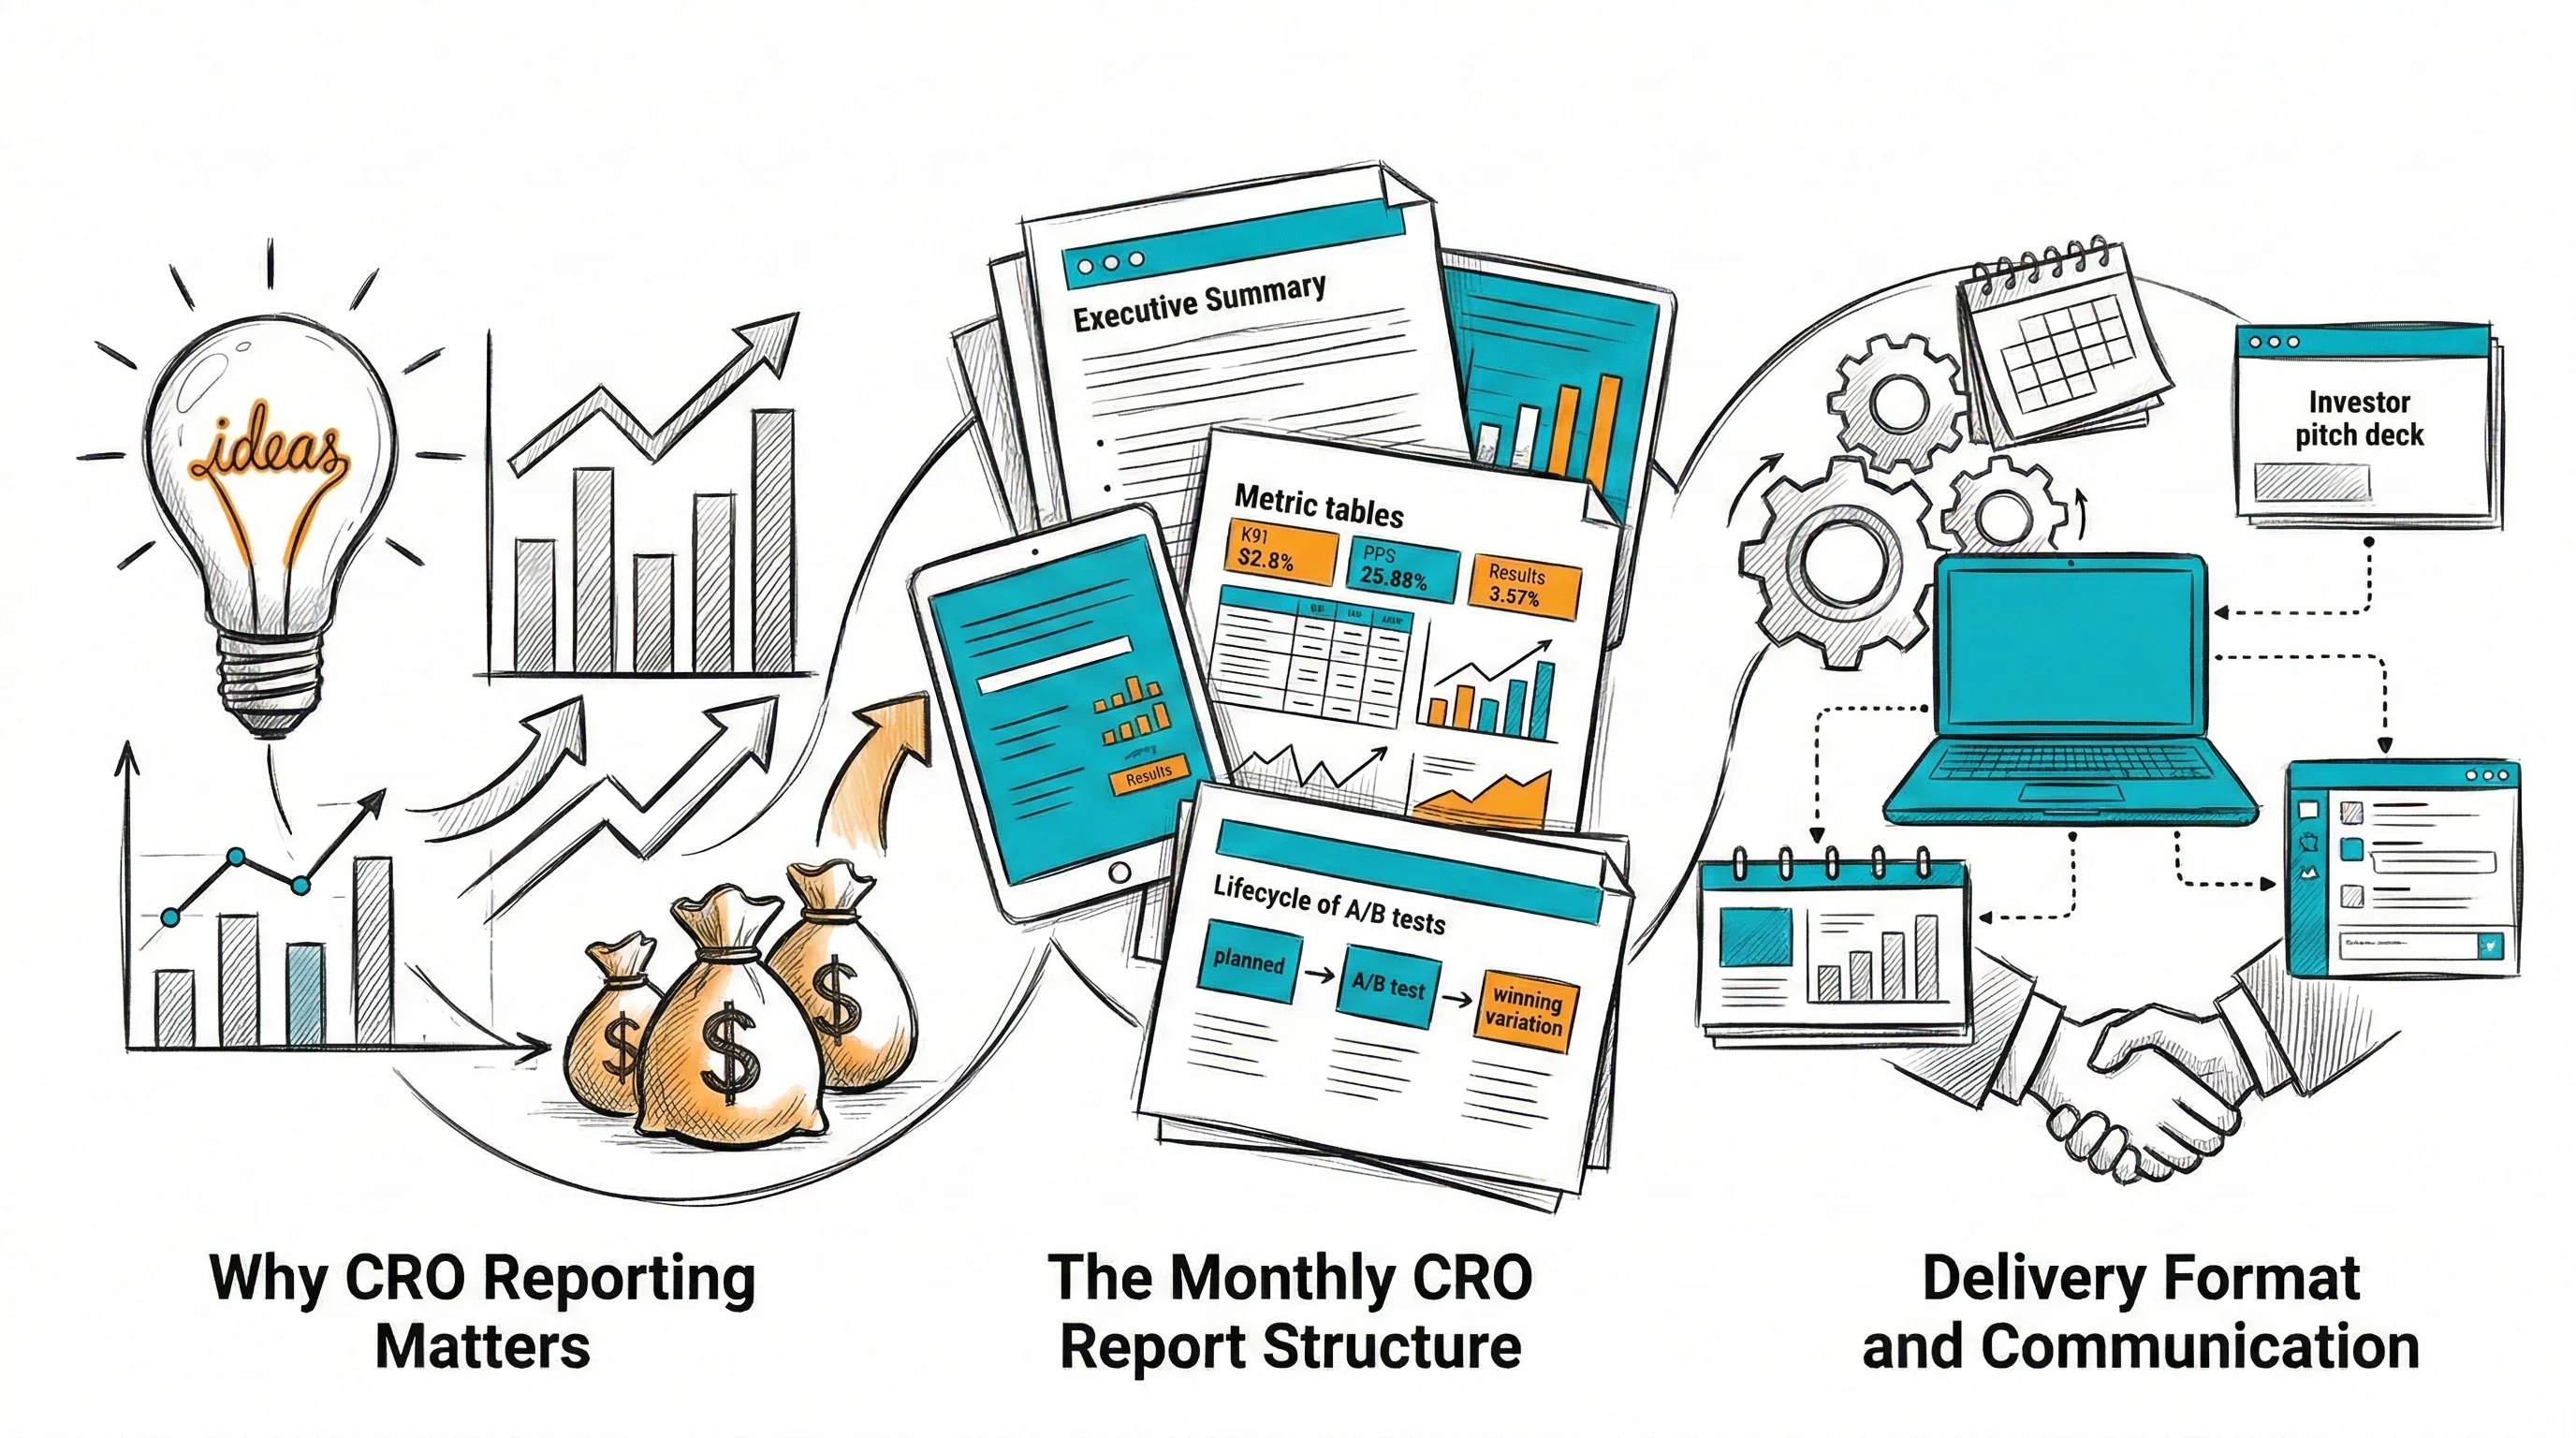
A monthly CRO report documents conversion rate performance, A/B test results, and the estimated revenue impact of optimization work — giving stakeholders a clear view of what the CRO program is delivering and what is planned next. Most ecommerce teams underreport CRO results, leading to budget cuts when business performance pressure rises. A well-structured monthly report keeps the CRO program funded, focused, and respected across the organization. This template is designed for D2C and ecommerce growth teams reporting to founders, marketing heads, or investors.
CRO without reporting is invisible work. Teams running A/B tests that improve conversion by 15–20% — generating hundreds of thousands of rupees in incremental revenue — often fail to communicate this impact clearly, leading to:
A monthly CRO report solves all of these by making optimization impact visible and connecting it to revenue.
Written for readers who will not read the rest of the report. Should be completable in 90 seconds.
Template:
Month: [Month Year] Overall Conversion Rate: [X%] vs. [X%] prior month vs. [X%] prior year Tests Completed: [N] Tests Won: [N] (delivering estimated ₹[X] additional monthly revenue) Tests Running: [N] Key Finding: [One sentence — the most important thing that happened in CRO this month] Next Month Focus: [One sentence — what the team will prioritize]
2.1 Overall CVR Trend
Display a line chart showing monthly CVR for the last 6–12 months. Annotate key events that affected CVR (sale events, product launches, traffic source changes, major test deployments).
2.2 CVR by Key Segment
| Segment | This Month | Prior Month | Change |
|---|---|---|---|
| All visitors | 2.4% | 2.1% | +14.3% |
| Mobile visitors | 1.8% | 1.5% | +20.0% |
| Desktop visitors | 3.2% | 3.0% | +6.7% |
| New visitors | 1.2% | 1.1% | +9.1% |
| Returning visitors | 5.8% | 5.3% | +9.4% |
| Organic search | 2.8% | 2.6% | +7.7% |
| Paid search | 3.1% | 2.9% | +6.9% |
| 4.2% | 4.0% | +5.0% |
Segment CVR shows where optimization is working and where gaps remain.
2.3 Funnel Performance
| Funnel Stage | This Month | Prior Month | Change |
|---|---|---|---|
| Landing → Product page | 38% | 36% | +2pp |
| Product page → Add to cart | 8.1% | 6.2% | +1.9pp |
| Cart → Checkout | 52% | 50% | +2pp |
| Checkout → Payment | 79% | 78% | +1pp |
| Payment → Confirmation | 94% | 93% | +1pp |
| Overall CVR | 2.4% | 2.0% | +0.4pp |
Highlight which funnel stage showed the largest improvement (often traceable to a specific test) and which stage remains the biggest opportunity.
3.1 Tests Completed This Month
For each completed test, provide a standard summary:
Test: [Test name, e.g., "Mobile Sticky CTA"] Page: [Product page — mobile] Hypothesis: [I believe the sticky CTA will increase mobile add-to-cart rate because...] Duration: [Start date] → [End date] ([N] days) Sample: [X,XXX] visitors per variant
| Metric | Control | Variant | Lift | Confidence |
|---|---|---|---|---|
| Add-to-cart rate | 6.2% | 8.1% | +30.6% | 97% ✓ |
| Mobile CVR | 1.8% | 2.3% | +27.8% | 95% ✓ |
Result: Variant B wins — deployed on [date] Revenue Impact: Estimated ₹[X] additional monthly revenue at current traffic levels Learning: [One sentence on the underlying insight]
3.2 Tests with No Significant Difference
For tests that did not find a winner:
Test: [Test name] Result: No significant difference after [N] visitors per variant Learning: [Why this matters — what we can rule out, what alternative hypothesis to try]
3.3 Tests Paused or Cancelled
With reason — traffic drop, implementation error, or strategic shift.
This section justifies the CRO program budget. Translate test results into money.
Revenue Impact Calculation:
For each winning test:
Cumulative Revenue Lift This Month: ₹[X] (from [N] tests deployed this month) Cumulative Revenue Lift Since Program Start: ₹[X] (from [N] tests deployed since [date])
Annualized value: If monthly lift is sustained, this represents ₹[X] annual revenue improvement.
Beyond test results, share qualitative observations:
These observations generate next month's hypotheses.
Tests Launching [Next Month]:
| Test Name | Page | Hypothesis Summary | Primary Metric | Est. Duration |
|---|---|---|---|---|
| Return policy above fold | Product page | Will lift CVR for first-time buyers | CVR | 3 weeks |
| EMI display on product page | Product page | Will lift add-to-cart for items >₹2K | Add-to-cart | 3 weeks |
| Exit intent popup | All pages | Will capture 3–5% departing visitors | Email capture | 4 weeks |
Tests in Preparation:
[Hypotheses being built into variants — not yet launched]
Hypotheses in Backlog:
[Next 5–10 ideas waiting for prioritization]
Who receives the report:
When:
Presentation tips for stakeholders:
Lead with revenue. "We ran 4 tests this month and two of them are delivering an estimated ₹8.5L annual revenue lift" is the opening line that gets attention.
Then the details. After revenue impact is established, stakeholders are more receptive to the statistical and methodological details that support the claim.
Acknowledge what didn't work. Reporting only wins makes CRO look like cherry-picking. Reporting failures demonstrates rigor and builds trust.
Connect to future plans. Stakeholders want to know: what are we doing next? The testing plan section answers this.
Quarterly, produce a simplified 1-page summary for broader stakeholder circulation:
Q[X] [Year] CRO Impact:
This format is suitable for board presentations, investor updates, and company-wide communication.
Reporting statistical significance without plain-language translation. "97% confidence" means nothing to most stakeholders. "We are 97% confident this is a real improvement" is clearer, and "this means less than 3% chance we are wrong" is clearest.
Reporting CVR without business context. A 0.3% CVR improvement sounds small until it is framed as ₹7,20,000 annual revenue at 20,000 monthly visitors and ₹1,200 AOV.
Not separating CVR changes from traffic mix changes. If your traffic source composition changed (more high-intent email visitors, fewer cold paid visitors), your CVR will change without any optimization work. Segment-specific CVR analysis isolates optimization impact from mix effects.
Reporting only winning tests. A CRO report that shows only test wins is incomplete and undermines credibility. Include inconclusive and negative results.
Related reading: