From the conversion glossary
Concepts referenced in this article, defined.
An A/B testing hypothesis predicts what change will improve a metric and why. Learn the proven formula: 'We believe [change] will [outcome] because [evidence].'
Concepts referenced in this article, defined.
Run rigorous A/B tests and personalize every visit on Shopify or any storefront — no engineers required.
An A/B testing hypothesis is a structured, falsifiable prediction: it states exactly what you're changing, what improvement you expect to see, and — critically — why the data suggests that change will work. Without it, you're not running an experiment; you're running a guess. And guesses, even when they win, teach you nothing replicable.
The reason most D2C brands get poor results from A/B testing isn't bad traffic or the wrong tool. It's that they jump straight to "let's test a red button" without asking why the button color would matter for their specific audience, page, and metric. A well-formed hypothesis changes that. It forces you to do the thinking upfront, which means your test queue is full of ideas grounded in evidence — and your win rate climbs.
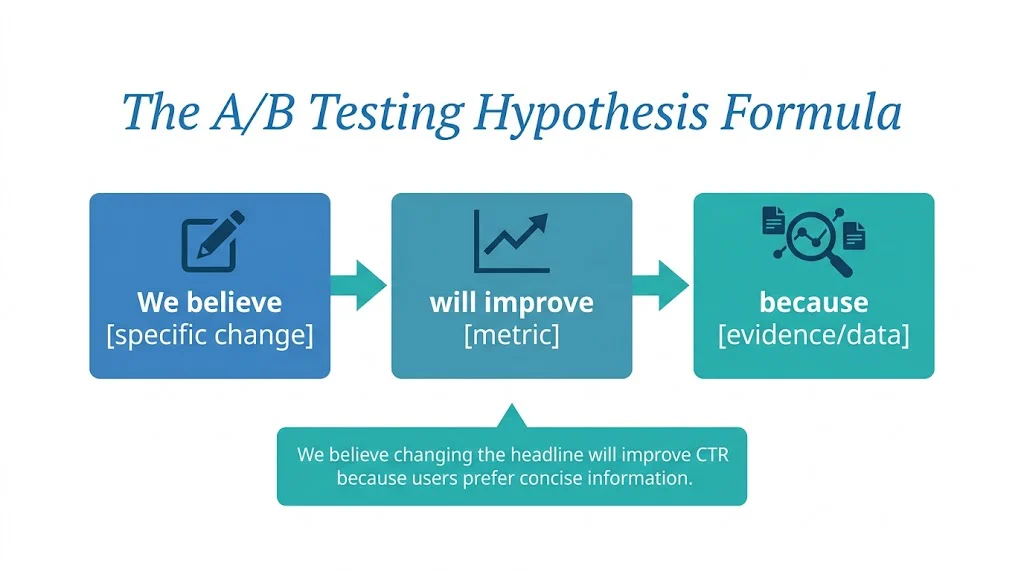
The most reliable format for an A/B testing hypothesis is:
"We believe [specific change] will [improve metric] because [evidence or reasoning]."
Each component does specific work. Remove any one of them and the hypothesis loses its value.
[Specific change] — What exactly are you changing? "Redesigning the product page" is not a specific change. "Adding a 30-day return guarantee badge below the Add to Cart button" is. One change per hypothesis, one element per test. If you change three things and the variant wins, you don't know which change drove the lift — and you can't replicate it.
[Improve metric] — What metric will move, and in which direction? "Improve performance" is not a metric. "Increase add-to-cart rate" is. "Reduce checkout abandonment rate" is. Tie the outcome to a single measurable primary metric, defined before the test launches. Secondary metrics can be monitored, but they don't determine the winner.
[Evidence or reasoning] — This is the component most teams skip, and it's the most important. The "because" is what separates a data-informed hypothesis from a shot in the dark. It forces you to cite the observation that made you believe this change is worth testing. "Because our exit survey shows 34% of visitors cite return policy uncertainty as a reason for not purchasing" is a strong because. "Because it worked for another brand" is weak but still better than nothing.
The table below shows hypothesis pairs across five common D2C ecommerce pages. The weak version is what most teams actually write. The strong version is what wins.
| Page | Weak Hypothesis | Strong Hypothesis |
|---|---|---|
| Product page | "We believe changing the product image will increase conversions." | "We believe adding a lifestyle image showing the product in use as the primary image will increase add-to-cart rate because heatmaps show 68% of clicks go to the image area and session recordings show users pinching to zoom to understand fit." |
| Checkout | "We believe simplifying checkout will reduce abandonment." | "We believe removing the account creation step from checkout will reduce abandonment rate because 41% of checkout drop-offs happen at the 'Create Account' prompt, per our funnel analytics." |
| Homepage | "We believe a new hero will improve engagement." | "We believe changing the homepage hero headline from our brand tagline to a specific offer ('Free shipping on orders above ₹999') will increase clicks to product pages because new visitor bounce rate is 72% and our top email subject line with the shipping offer had a 31% CTR." |
| Cart | "We believe adding urgency will help conversions." | "We believe adding 'Only 3 left in stock' inventory alerts to cart items will increase cart-to-checkout rate because cart abandonment is highest for SKUs that later go out of stock, per our inventory and abandonment correlation analysis." |
| Pricing / PDP | "We believe showing EMI options will improve sales." | "We believe adding a 'Pay in 3 installments via Razorpay' option below the price on products above ₹2,000 will increase purchase rate because our support tickets show 18% of pre-sale queries ask about payment flexibility for high-ticket items." |
Notice the pattern: strong hypotheses cite a specific data point in the "because." That data point is the link between observation and experiment. It's also what you return to when the test ends — whether it won or lost — to update your mental model of your customer.
The quality of your hypothesis depends entirely on the quality of your evidence. Here are the four most productive sources.
Your analytics platform is the first place to look. Funnel reports show you exactly where drop-offs happen — if 60% of visitors who reach the product page don't add to cart, that's your highest-value optimization target. Exit page reports show which pages visitors abandon most. Scroll depth data reveals how far users read before leaving.
For Indian D2C brands, segment your analytics by device before drawing conclusions. Mobile traffic often behaves fundamentally differently from desktop — a hypothesis that makes sense for desktop shoppers might be irrelevant or even harmful on mobile.
Heatmaps show where users click (and don't click), how far they scroll, and where their attention concentrates. Session recordings let you watch real users navigate your site. Together, they reveal friction points that analytics can't.
Common findings that generate strong hypotheses:
Your support inbox is a goldmine of conversion obstacles. Sort your last 100 pre-purchase support tickets by topic. The most common questions are the objections you haven't answered on the page. If 20% of tickets ask about delivery time, your product page isn't making delivery time clear enough — that's a testable hypothesis.
Post-purchase surveys asking "What almost stopped you from buying?" surface the same objections from people who did convert. Both perspectives matter.
Systematically browsing competitor product pages and checkout flows surfaces patterns worth testing. If three of your direct competitors all show a prominent size guide, there's likely data behind that decision. Don't copy blindly — adapt to your audience — but competitor patterns are useful hypothesis inputs.
Once you have a hypothesis backlog, you need a systematic way to decide what to test first. The ICE framework scores each hypothesis on three dimensions, each rated 1–10:
ICE Score = (Impact + Confidence + Ease) / 3
Run the highest ICE scores first. This is especially practical for lean teams where engineering time is limited — you want your development effort going to tests most likely to win and make a meaningful difference.
Here are ready-to-adapt hypotheses for the pages that drive the most D2C revenue.
Product Page — Headline
"We believe changing the product page H1 from the product name ('Ikat Kurta - Navy Blue') to a benefit-led description ('Handwoven Ikat Kurta — Stays Cool in 40°C') will increase add-to-cart rate because session recordings show users spending time on the fabric description section before leaving, suggesting heat comfort is a key purchase driver."
Add-to-Cart Button
"We believe changing the Add to Cart button copy from 'Add to Cart' to 'Add to Cart — Free Delivery' will increase button click rate because our analytics show a 23% drop in add-to-cart rate among users who visit the shipping policy page before the product page."
Checkout Form
"We believe replacing the standard address form with a PIN code-first autocomplete flow will reduce checkout abandonment rate because our support data shows address entry errors as the second most common checkout support request."
Homepage Hero
"We believe replacing the brand-story hero image with a 'Top Picks This Week' product grid will increase click-through to product pages because new visitors (who have no brand context) have a 68% bounce rate and the product grid gets 3x more clicks than the hero CTA in our current above-fold layout."
A single strong hypothesis gets you one test. A backlog of 20 strong hypotheses gets you a testing program.
Structure your backlog as a shared document or spreadsheet with columns for: page, element being tested, hypothesis statement (full "We believe... will... because..." format), evidence source, ICE score, status (queued / running / complete), and outcome.
Review and refill the backlog monthly. As tests complete, the results — both wins and losses — generate new hypotheses. A loss is especially valuable: if the variant didn't win, why not? Did users respond differently than expected? That insight feeds the next hypothesis.
CustomFit.ai includes a built-in hypothesis management workflow so your team's evidence and hypotheses stay connected to live tests, not buried in a spreadsheet tab no one revisits.
The most effective testing programs aren't the ones that run the most tests — they're the ones that run the most tests grounded in strong, evidence-backed hypotheses. Start by learning what A/B testing is, then put this hypothesis framework to work when you run your first tests.
1,000+ D2C brands use CustomFit.ai to run A/B tests — without code, without developer tickets. 14-day free trial · No credit card required.