From the conversion glossary
Concepts referenced in this article, defined.
Concepts referenced in this article, defined.
Run rigorous A/B tests and personalize every visit on Shopify or any storefront — no engineers required.
A/B testing product pages is the most direct path to increasing add-to-cart rate and conversion rate for ecommerce brands — because this is the page where purchase decisions are made. The highest-impact product page tests are product image presentation, price display framing, description structure, and CTA button placement, with brands consistently seeing 8–25% lifts from single-element tests on well-trafficked pages. For D2C brands like Bellavita (11% CVR lift) and Kapiva (9.48% CVR improvement), continuous product page optimization is the core growth mechanism — not increasing ad spend.
This guide covers the complete product page testing framework: what to test, what order to test it in, and what the data says about each element.

Before running tests, understand the elements that drive a visitor from landing to purchase:
Your tests should address each of these in order. Brands that jump straight to button color tests without addressing trust issues will see marginal lifts. Brands that fix trust and clarity issues first see compounding improvements.

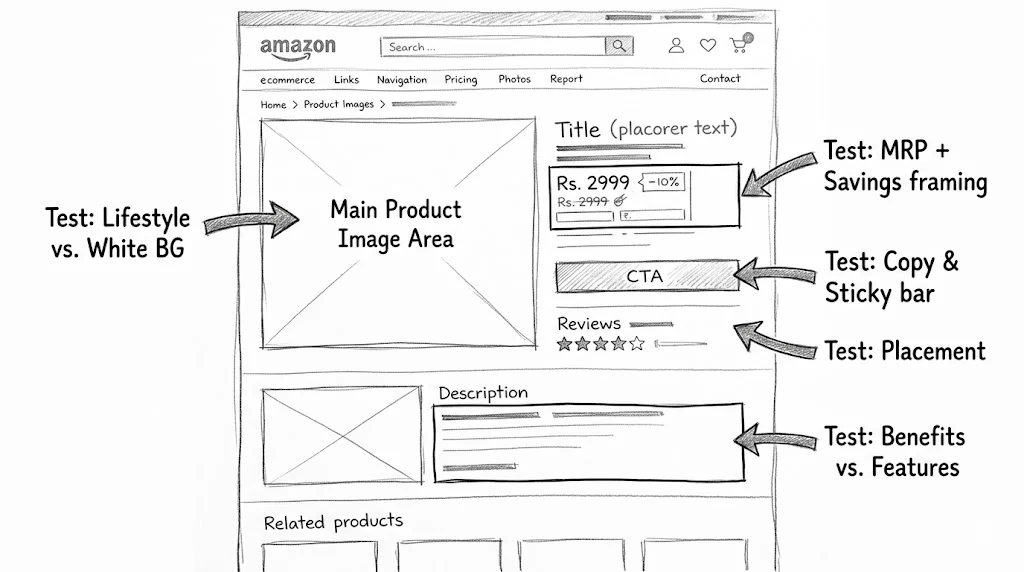
Product images are the most influential element on the page — they establish desire and trust simultaneously.
Test: Main image style
What typically wins for Indian D2C: For beauty and skincare brands (mCaffeine, Plum, Mamaearth), lifestyle images showing the product in use on South Asian skin consistently outperform white-background product shots. For fashion brands (Sugar, Boat), model images showing fit and styling outperform product-only images.
Test: Image gallery order The sequence of images matters. Test:
Test: Image zoom and hover behavior Does enabling zoom on product images increase or decrease conversion rate? For skincare and beauty, zoom often helps (customers examine texture/packaging). For simple products, it adds no value.
Test: Video addition Adding a 15–30 second product demonstration video to the gallery:
How you display price dramatically affects perceived value.
Test: Savings framing
For Indian D2C, showing MRP crossed out with the discounted price is nearly universal — but the exact format matters. Test whether showing percentage saved or rupee amount saved performs better. For products above ₹999, rupee savings ("Save ₹300") often outperform percentage ("Save 23%"). Below ₹999, percentage often wins.
Test: EMI display For products above ₹1,500, showing EMI options near the price can lift conversions:
Test: Price position
Most ecommerce brands write product descriptions as one long paragraph. This is a missed opportunity.
Test: Description format
Benefit-led example:
Test: Description placement
Test: First line of description The first line of your product description is disproportionately important — it's what mobile users see before scrolling. Test:
See our A/B testing CTA buttons guide for the complete framework. For product pages specifically:
Test: CTA copy
Test: Sticky mobile CTA A floating "Add to Cart" bar that stays visible as users scroll the product description is one of the highest-ROI tests for mobile. Indian D2C brands with 70%+ mobile traffic consistently see 10–20% mobile ATC lifts from this.
Test: CTA button with urgency
Important: only use real inventory and real sale end times. False urgency damages brand trust, and Indian shoppers are increasingly skeptical.
Reviews and social proof are critical for converting hesitant buyers.
Test: Review section position
Test: Review format
Test: Social proof type
If your product has size, color, or flavor variants, how they're displayed matters.
Test: Color swatch vs. dropdown Color swatches (visual squares) consistently outperform dropdowns for fashion and beauty. Test your variant selector if it's currently a dropdown.
Test: Size guide placement A visible size guide link near the size selector reduces return rates and can lift conversion. Test with/without, and test placement.
Test: Out-of-stock variant handling
| Element | Test Idea | Expected Impact |
|---|---|---|
| Hero image | South Asian model vs. product shot | 10–20% ATC lift |
| Price | MRP + % savings vs. MRP + ₹ savings | 3–8% CVR lift |
| EMI display | With EMI vs. without (for ₹1,500+) | 5–15% lift on high-price products |
| COD badge | "COD available" above CTA vs. not | 8–15% lift for Tier 2 traffic |
| Description | Benefit bullets vs. feature bullets | 5–12% ATC lift |
| CTA | Sticky mobile bar vs. standard | 10–20% mobile ATC lift |
| Reviews | Star rating below price vs. below CTA | 5–10% CVR lift |
| Pincode check | "Check delivery date" widget visible vs. hidden | 5–10% lift |
CustomFit.ai lets you test any of the above without a developer:
CustomFit.ai's 1,000+ targeting attributes let you run product-page tests for specific segments: first-time visitors, returning customers, users from Instagram ads vs. organic search, Tier 1 vs. Tier 2 cities.
Track these metrics for every product page test:
| Metric | Purpose |
|---|---|
| Add-to-cart rate | Immediate purchase intent signal |
| Conversion rate | Final purchase completion |
| AOV | Does the variant attract different buyer profiles? |
| RPV | Single best metric combining CVR and AOV |
| Bounce rate | Are visitors engaged? |
| Time on page | Engagement indicator |
Never judge a product page test solely on add-to-cart rate. A variant that lifts ATC but decreases purchase completion or AOV may be a net loss. RPV is the cleanest single metric.