From the conversion glossary
Concepts referenced in this article, defined.
Concepts referenced in this article, defined.
Run rigorous A/B tests and personalize every visit on Shopify or any storefront — no engineers required.
Ecommerce analytics is the practice of collecting, measuring, and interpreting data about your online store's traffic, behaviour, and revenue to make better business decisions. For D2C brands in 2026, analytics is not a reporting exercise. It is the foundation for every growth decision, from ad spend allocation to A/B test prioritisation to product assortment. This guide covers what to measure, how to set up tracking correctly, and how to translate data into revenue-driving actions.
Ecommerce analytics covers all data collection and analysis activities related to your online store. At its broadest, it includes:
In 2026, ecommerce analytics for D2C brands must also account for:
Without analytics, growth decisions rest on intuition: which product to promote, which channel to invest in, which page to redesign. Intuition is an expensive approach when ad costs are high and margins are thin.
Analytics enables five things in particular.
Ad spend efficiency. If your Google Shopping campaigns convert at 4.2% and your Meta Advantage+ campaigns convert at 1.8% (after correctly attributing multi-touch journeys), you should allocate budget accordingly. Without accurate analytics, you might be scaling your worst-performing channel.
Prioritised CRO investment. Your top 10 pages by traffic and revenue are the right starting point for A/B testing. Analytics identifies them instantly. Without analytics, CRO is guesswork.
Profitable growth forecasting. Understanding your CAC, LTV, and contribution margin by cohort lets you model how much you can spend to acquire a customer and remain profitable. This is the foundation of scaling.
Inventory and merchandising decisions. Revenue per visitor by product category tells you where to invest in content, CRO, and inventory. Low-traffic, high-CVR categories are often underinvested.
Personalisation inputs. Segment-level analytics (what does a visitor from Tier 2 cities look at vs. a metro visitor? What do returning customers click that new visitors do not?) feeds personalisation strategy and targeting in tools like CustomFit.ai.
The India-specific data context: Indian D2C brands face unique analytics challenges:
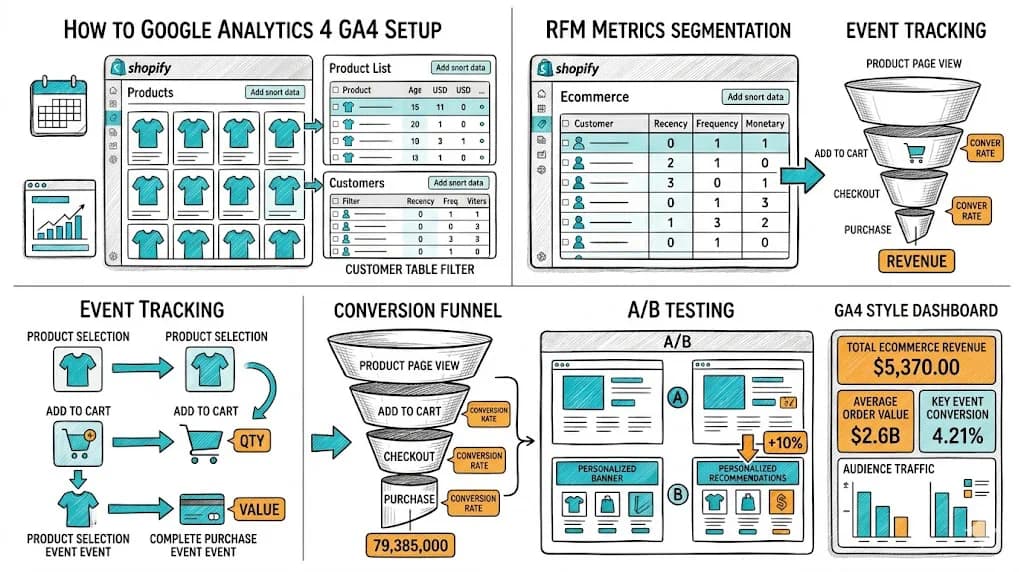
For most Shopify D2C brands, the starting point is GA4 with enhanced ecommerce tracking:
Important: GA4's default ecommerce tracking through the Shopify app misses some events. Use Google Tag Manager for precise event tracking (product click, add-to-cart with variant data, checkout step tracking).
In GA4, configure a funnel exploration that maps your key purchase path:
Identify the step with the highest drop-off rate. That is your first CRO priority.
GA4's default dimensions do not include D2C-specific data. Add:
Analytics tells you what is happening; session recordings tell you why. Install Hotjar, Lucky Orange, or Microsoft Clarity (free) on your store. Configure these tools to record sessions on your highest-traffic pages and set up heatmaps for your PDP and cart page.
Configure GA4's attribution settings to match your business model:
For Meta and Google Ads, compare platform-reported conversions against GA4 to understand the discrepancy (typically 20-40% due to iOS attribution gaps and cross-device journeys).
Create a weekly KPI dashboard (using GA4's Looker Studio integration or a dedicated BI tool) that tracks:
Conversion rate (CVR): Sessions that resulted in a purchase divided by total sessions. Benchmark: 2-4% for D2C ecommerce. Top performers: 5-8%.
Add-to-cart rate: Sessions with an add-to-cart event divided by total sessions. A useful leading indicator of PDP performance. Benchmark: 8-15%.
Checkout completion rate: Orders placed divided by checkout initiations. Measures how many people who started checkout finished it. Benchmark: 50-70% for well-optimised checkouts.
Revenue per visitor (RPV): Total revenue divided by total sessions. The single most important CRO metric because it combines conversion rate and order value. Use RPV as the primary success metric for A/B tests.
Average order value (AOV): Total revenue divided by total orders. Benchmark: varies widely by category (approximately Rs 600-Rs 2,500 for most Indian D2C brands). Test bundles, upsells, and free shipping thresholds to improve AOV.
Gross revenue vs. net revenue: Always track net revenue (after returns, discounts, and COD cancellations). Gross revenue looks fine on a dashboard but can mask a deteriorating return or cancellation rate.
Customer acquisition cost (CAC): Total marketing spend divided by new customers acquired. Compare against LTV to determine marketing efficiency.
Customer lifetime value (LTV): Average revenue per customer multiplied by average purchase frequency and average customer lifespan. For subscription or repeat-purchase D2C brands, the LTV:CAC ratio is the primary health metric.
Repeat purchase rate: Customers who placed 2+ orders divided by total customers. Benchmark: 25-40% for D2C brands with annual repurchase cycles.
Bounce rate: Sessions where the visitor left after viewing only one page. High bounce rates on PDPs (above 60%) indicate a mismatch between the traffic source's expectation and what the page delivers.
Traffic by source/medium: What percentage of revenue comes from each channel (paid social, organic search, email, direct, referral). Use this to evaluate channel contribution, not just traffic volume.
New vs. returning visitor mix: A healthy D2C brand should see 30-40% returning visitors. If the ratio skews heavily toward new visitors, retention is the issue.
1. Measure revenue, not just traffic. Traffic is vanity; revenue is sanity. A campaign that drives 10,000 sessions at 1% CVR underperforms a campaign that drives 3,000 sessions at 4% CVR. Always evaluate channels and pages by revenue and RPV, not raw session counts.
2. Segment everything. Aggregate metrics hide insights. Always segment by device (mobile vs. desktop), by traffic source, by new vs. returning, and by geo (metro vs. Tier 2/3). Your aggregate 2.5% CVR may be driven by 4.5% desktop CVR masking a 1.8% mobile CVR. That is a significant mobile UX problem that aggregate data will not show.
3. Use weekly year-over-year comparisons during festive periods. Indian D2C revenue is highly seasonal. Week-over-week growth can look catastrophic if you are comparing post-Diwali November to a peak-Diwali October week. Year-over-year comparisons remove seasonal noise and reveal true underlying growth.
4. Set up alerts for anomalies. Configure GA4 intelligence alerts or custom alerts in Looker Studio for significant deviations: CVR drops more than 15%, revenue is more than 20% below the prior week's pace by Monday midday, checkout abandonment rate spikes. These alerts help you catch tracking breaks, site errors, or campaign problems quickly.
5. Never make permanent site changes without testing. Analytics identifies what to change and where. A/B testing tells you how to change it. Do not use analytics as the sole basis for implementing permanent changes. Use it to prioritise what to test.
6. Reconcile GA4 with Shopify revenue reports weekly. GA4 and Shopify report revenue differently (GA4 uses session-level attribution; Shopify uses order-level data). Regular reconciliation catches tracking gaps early and maintains data hygiene.
7. Build separate dashboards for different stakeholders. Your CMO needs a revenue and ROAS view. Your performance marketer needs a CAC-by-channel view. Your CRO team needs a funnel conversion and RPV view. One aggregate dashboard serves no one well.
8. Track micro-conversions, not only final purchase. Track add-to-cart rate, checkout initiation rate, and email capture rate as leading indicators of future purchase. A drop in add-to-cart rate two weeks before a revenue dip gives you a two-week head start on diagnosing and fixing the problem.
9. Audit your tracking setup quarterly. Shopify theme updates, new apps, and GA4 updates can break event tracking silently. Quarterly tracking audits (checking that all ecommerce events fire correctly in GA4 DebugView and Tag Manager preview mode) prevent weeks of missing data.
10. Combine quantitative and qualitative data. Analytics tells you the what and where. Session recordings, customer surveys, and qualitative research tell you the why. Both are necessary for effective optimisation.
| Tool | Primary Use | Cost | Shopify Integration |
|---|---|---|---|
| Google Analytics 4 | Web analytics, funnel analysis | Free | Native (via Google app) |
| Looker Studio | Dashboard and reporting | Free | Via GA4 connector |
| Hotjar | Session recordings, heatmaps, surveys | From $32/mo | Tag or Shopify app |
| Microsoft Clarity | Session recordings, heatmaps | Free | Tag manager |
| CustomFit.ai | A/B testing with analytics integration | From $99/mo | Native Shopify |
| Klaviyo | Email analytics, cohort analysis | From $45/mo | Native Shopify |
| Triple Whale | D2C attribution, profit analytics | From $129/mo | Native Shopify |
| Northbeam | Multi-touch attribution | Custom | Native Shopify |
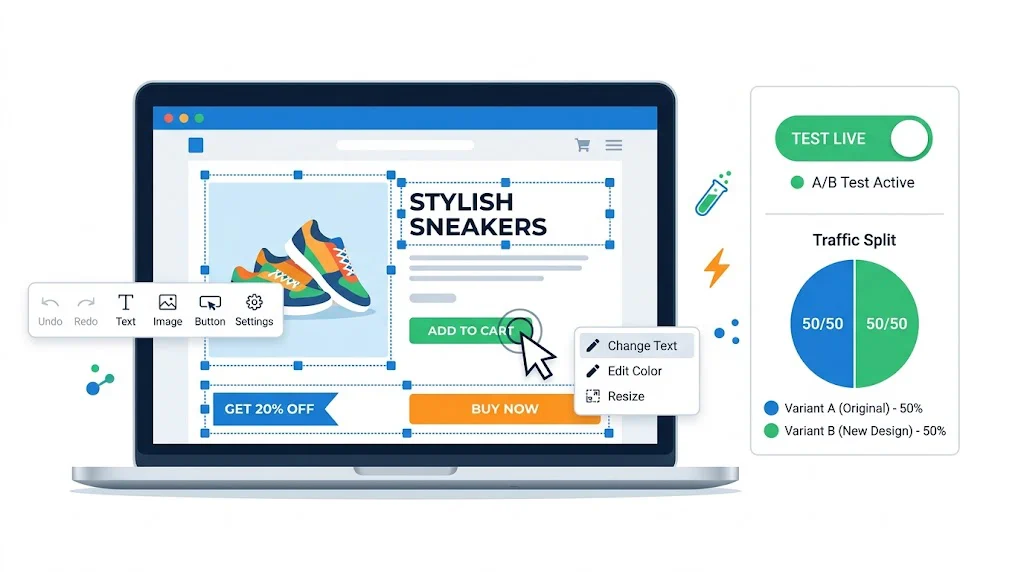
CustomFit.ai's analytics integration: CustomFit.ai natively reads Shopify transaction data, so A/B test results are measured against real revenue (RPV, AOV) rather than proxy click metrics. This makes it one of the more analytically rigorous testing tools for D2C brands. See CustomFit.ai vs VWO for a comparison of analytics depth between tools.
Kapiva's analytics team identified a significant drop-off between PDP views and add-to-cart events on mobile. The funnel data showed 10,000 mobile PDP views per week but only 680 add-to-cart events (a 6.8% add-to-cart rate vs. 11% on desktop).
The hypothesis: mobile visitors were not scrolling far enough to reach the CTA. Session recordings confirmed it. 55% of mobile visitors left before scrolling to the Add-to-Cart button.
The fix was tested using CustomFit.ai: moving the CTA above the fold on mobile. Result: 9.48% CVR improvement across mobile traffic. The analytics setup made the problem visible and measurable; the A/B test confirmed the fix.
Bellavita's aggregate analytics showed high traffic from Instagram but modest direct conversion from the platform. After implementing server-side event tracking and a more sophisticated attribution model (data-driven, considering all touchpoints), they found that Instagram drove the first touchpoint for 42% of customers who later converted via Google or email.
This changed their Meta budget allocation. Instagram was reframed as a discovery and brand-building channel rather than a last-click revenue channel, and budgeted accordingly. Reducing pressure on Instagram ROAS while measuring its impact on top-of-funnel assisted conversions allowed them to scale it more effectively.
The broader lesson: attribution modelling changes budget decisions. First-touch and last-touch attribution tell very different stories about which channels are working.
A D2C supplements brand used cohort analysis to discover that customers acquired during Diwali promotions (with heavy discounting) had 40% lower LTV than customers acquired at full price via organic content. The Diwali cohort churned at 70% after one purchase, while organic cohorts reordered at 45%.
This insight changed their festive strategy. Rather than deep discounting to maximise Diwali revenue, they shifted to gift-set bundles at modest discounts that attracted customers buying for the product rather than the deal. LTV for Diwali 2024 cohorts improved significantly.
Mistake 1: Trusting GA4 revenue numbers without reconciliation. GA4 undercounts revenue by 15-30% for most Shopify stores due to iOS tracking restrictions, ad-blockers, and cross-device journeys. Always reconcile with Shopify's admin revenue report and treat GA4 as a directional rather than absolute revenue source.
Mistake 2: Optimising for traffic instead of revenue per visitor. A traffic increase that does not improve RPV is spending, not growth. Every analytical exercise should connect back to how changes affect revenue, not just visits.
Mistake 3: Not segmenting COD vs. prepaid orders. COD orders have higher cancellation and return rates than prepaid. If your analytics does not separate these, you may be optimising for gross orders that inflate your CVR while revenue net of returns is flat or declining.
Mistake 4: Seasonal benchmarking errors. Comparing month-on-month during Diwali season to the preceding month (September) will show massive apparent growth that is entirely seasonal. Use year-over-year comparisons for all seasonal period analysis.
Mistake 5: Ignoring the mobile-desktop performance gap. Aggregate CVR data can hide a poor mobile experience. Always view conversion metrics segmented by device before drawing conclusions.
Mistake 6: Using last-click attribution for all decisions. Last-click attribution overweights branded search and direct channels while underweighting awareness channels (Instagram, influencer, YouTube). Decisions made on last-click data systematically underfund acquisition and overfund retention.
With iOS 17's advanced privacy features and browser-based cookie restrictions, client-side tracking (standard GA4 pixel) is increasingly unreliable. Server-side tracking (where Shopify sends events directly to GA4 via the Measurement Protocol) bypasses browser restrictions and provides more complete data. For Indian D2C brands spending significant amounts on Meta and Google, server-side tracking is now a foundational requirement.
GA4's predictive metrics (Purchase Probability for the next 7 days, and Churn Probability) are available for stores with sufficient conversion volume, generally 1,000+ purchases over 28 days. These predictive audiences can be used to:
Beyond paid channel attribution, advanced D2C analytics includes content attribution: which blog posts, product education content, or quiz completions precede purchases at higher-than-average rates. This analysis identifies content investments that drive measurable revenue (not just traffic) and informs your content strategy.
Use GA4's path analysis and session source reports to trace the pages visited before a purchase and identify non-obvious content revenue drivers.
During Diwali, Big Billion Days, and other high-volume events, real-time analytics monitoring allows rapid response to problems:
Build a real-time Looker Studio dashboard and staff it during peak sale events.
What is ecommerce analytics? Ecommerce analytics is the collection, measurement, and interpretation of data from your online store (traffic, behaviour, conversion, and revenue) to inform business decisions and improve performance.
Which metrics matter most for D2C ecommerce? The five metrics that have the most direct impact on D2C profitability are: conversion rate, revenue per visitor (RPV), average order value (AOV), customer acquisition cost (CAC), and customer lifetime value (LTV). Track these before any others.
What is the difference between Google Analytics 4 and Universal Analytics? Universal Analytics (UA) was sunset by Google in July 2023. Google Analytics 4 (GA4) is the current platform, using an event-based data model instead of session-based. GA4 requires more intentional setup for ecommerce tracking compared to UA's ecommerce tracking plugin.
How do I set up ecommerce tracking on Shopify? Install GA4 via the Google & YouTube Shopify app for basic tracking. For advanced event tracking (product clicks, add-to-cart, checkout steps), use a Google Tag Manager container with custom dataLayer events, or a dedicated Shopify analytics app.
What is attribution and why does it matter for D2C? Attribution is the process of assigning credit for a conversion to the marketing touchpoints a customer interacted with before buying. D2C brands with multi-channel marketing (Meta, Google, email, influencer) need accurate attribution to understand which channels are profitable and which are over-credited.
What is cohort analysis and how do I use it? Cohort analysis groups customers by a shared characteristic (usually first purchase date) and tracks their behaviour over time. For D2C, it reveals LTV curves, repeat purchase rates by acquisition channel, and the impact of product quality on retention.
How do I use analytics data to improve conversions? Use analytics to identify high-traffic pages with above-average bounce rates or below-average conversion rates. These are your highest-priority A/B test candidates. Then use session recordings to diagnose why and CustomFit.ai to test fixes.
What is funnel analysis in ecommerce analytics? Funnel analysis tracks how many visitors complete each step in a defined sequence (e.g., homepage to category to PDP to cart to checkout to purchase) and identifies the step with the highest drop-off rate, which becomes the primary optimization target.
Analytics tells you where the problem is. CustomFit.ai helps you fix it, with no-code A/B testing, D2C-native metrics (RPV, AOV), and Shopify-native revenue tracking.