From the conversion glossary
Concepts referenced in this article, defined.
Concepts referenced in this article, defined.
Run rigorous A/B tests and personalize every visit on Shopify or any storefront — no engineers required.
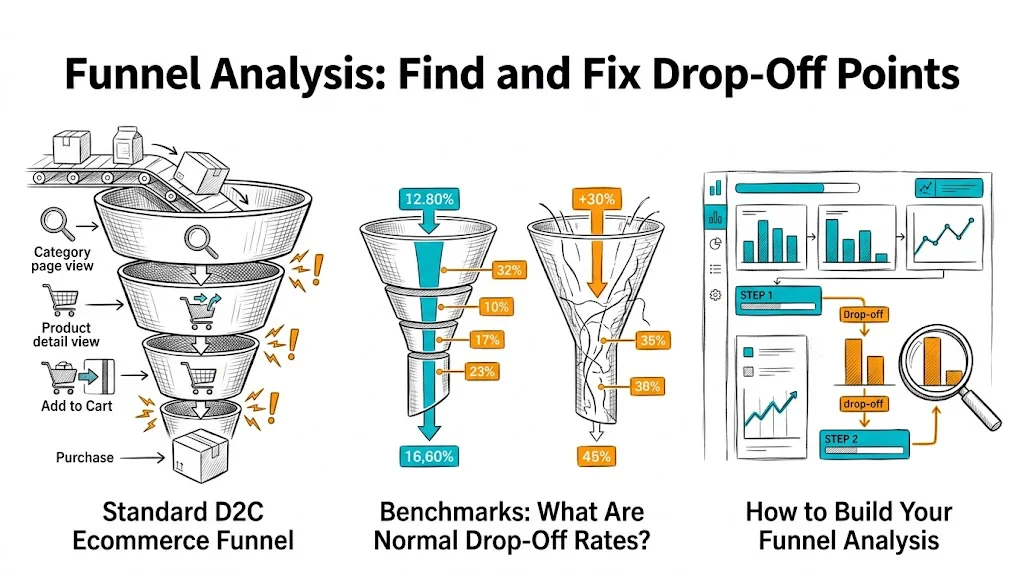
Funnel analysis maps where visitors drop out of your purchase journey, stage by stage, so you can fix the specific steps that are losing revenue. Without funnel analysis, CRO is guesswork — you might optimize your product page when 80% of your revenue loss happens at checkout, or add exit intent popups to a problem that originates on the category page. Funnel analysis directs your optimization effort to the stages with the highest drop-off and the largest revenue impact.
For Indian D2C brands, the funnel has additional complexity: COD orders have different completion patterns than prepaid, mobile funnels behave differently from desktop, and festive season traffic creates temporary funnel distortions. A clean funnel analysis accounts for these factors.
For a Shopify-based D2C brand, the standard funnel looks like this:
Traffic Arrives (paid, organic, social, direct)
         ↓
Landing Page / Homepage
         ↓ (drop-off: visitors who bounce immediately)
Category / Collection Page
         ↓ (drop-off: visitors who browse but don't click to a product)
Product Detail Page (PDP)
         ↓ (drop-off: visitors who read but don't add to cart)
Cart
         ↓ (drop-off: cart abandonment)
Checkout (Step 1: Contact Info)
         ↓ (drop-off: form friction or trust issues)
Checkout (Step 2: Shipping)
         ↓ (drop-off: unexpected shipping costs)
Checkout (Step 3: Payment)
         ↓ (drop-off: payment method issues or final hesitation)
Order Confirmation (Conversion)
Each stage has two numbers that matter: conversion rate (visitors who proceed) and drop-off rate (visitors who exit). The stage with the highest absolute number of lost visitors is usually your biggest opportunity.
Understanding whether your funnel has a problem requires benchmarks. These are typical ranges for Indian D2C ecommerce:
| Funnel Stage | Typical Conversion Rate | Drop-Off Rate |
|---|---|---|
| Homepage → Category | 30–45% | 55–70% |
| Category → Product Page | 35–55% | 45–65% |
| Product Page → Add to Cart | 8–20% | 80–92% |
| Cart → Checkout Initiation | 50–70% | 30–50% |
| Checkout → Order Completion | 60–80% | 20–40% |
| Overall (Traffic → Purchase) | 1–4% | 96–99% |
Important: These are starting benchmarks, not targets. Brands with strong organic search (high purchase intent) often see above-benchmark rates. Brands with broad awareness traffic see below-benchmark rates because the traffic is less qualified.
COD vs. prepaid split: COD checkout completion rates are typically 10–20 percentage points lower than prepaid because COD customers sometimes cancel on delivery. Track these separately.
Option 1: GA4 Funnel Exploration GA4's Funnel Exploration report (under Explore → Funnel Exploration) lets you define custom funnel steps and see drop-off at each stage.
Setup:
session_start → view_item_list → view_item → add_to_cart → begin_checkout → purchaseOption 2: Shopify Analytics Shopify's built-in "Online Store Conversion" report shows sessions, product page views, ATC rate, checkout rate, and purchase rate. It's less granular than GA4 but sufficient for most small D2C brands.
Option 3: CustomFit.ai CustomFit.ai provides funnel analytics alongside A/B test results, showing how your experiments affect each funnel stage — not just the page being tested.
If 60–70%+ of visitors bounce immediately from their landing page, the problem is likely:
Diagnosis approach: Segment bounce rate by traffic source. If organic search visitors have 30% bounce and paid social has 75% bounce, the paid targeting or ad creative is misaligned.
If visitors browse category pages but don't click through to products:
Diagnosis approach: Use click maps on category pages to see which products get clicked and which are ignored. Session recordings reveal navigation confusion.
This is the highest-leverage funnel stage for most D2C brands — it's where purchase decisions are made.
If add-to-cart rate is below 8% (low) or between 8–12% (room for improvement):
Diagnosis approach:
Cart abandonment of 70–75% is the Indian ecommerce average. If yours exceeds 80%, investigate:
Diagnosis approach: Session recordings of cart sessions. Filter for sessions where the user viewed the cart for more than 30 seconds but didn't initiate checkout — these sessions often reveal the hesitation moment.
If checkout has high overall completion but drops at a specific step:
Diagnosis approach: Checkout step-by-step drop-off in GA4's funnel report. Which specific step loses the most visitors? Session recordings of incomplete checkouts are the most direct diagnostic tool.
Once you've identified a drop-off stage, follow this process:
1. Identify the likely cause (from heatmaps, session recordings, exit surveys)
2. Form a hypothesis: "If we [add free shipping progress bar to cart page], then [cart-to-checkout rate will increase] because [session recordings show visitors checking price/shipping details before abandoning]."
3. Build the test in CustomFit.ai (no developer required for most cart and product page changes)
4. Run to statistical significance (don't stop early)
5. Roll out winners, document learnings from losses
For Indian D2C brands, mobile and desktop funnels often look dramatically different:
| Stage | Mobile Drop-Off | Desktop Drop-Off |
|---|---|---|
| Landing page | Higher (slow loads, small screens) | Lower |
| Category page | Similar | Similar |
| Product page | Higher (scroll fatigue) | Lower |
| Cart | Higher (form friction) | Lower |
| Checkout | Significantly higher (form fields) | Lower |
Action: Run your funnel analysis separately for mobile and desktop traffic. Identify which stages have the largest mobile-specific drop-off and prioritize those for mobile-specific optimization.
Indian D2C funnel behavior changes dramatically during Diwali, Navratri, and year-end sales:
Important: Don't use festive season funnel data as your baseline. Analyze festive performance separately from regular-period performance. Your CRO program should optimize for normal-period conversion first, then layer in festive-specific optimizations.
Run your funnel analysis quarterly, not annually — seasonal patterns, new product launches, and marketing mix changes all shift funnel behavior.
Segment by device immediately — mobile vs. desktop funnel analysis reveals completely different optimization priorities for most Indian D2C brands.
Track COD and prepaid separately throughout the funnel — COD checkout behavior is fundamentally different and shouldn't be aggregated with prepaid analysis.
Use GA4's Funnel Exploration, not basic funnel reports — GA4's exploration tool lets you define custom events and segment by dimensions that basic reports don't support.
Identify your single biggest drop-off stage — don't try to fix all stages simultaneously. Find the stage with the highest absolute revenue loss and start there.
Combine funnel data with heatmaps — funnel analysis tells you where visitors leave; heatmaps and session recordings tell you why. You need both for effective CRO.
Document your funnel baseline before starting CRO — write down your current conversion rates at each stage. This creates a measurement baseline that lets you calculate ROI from each improvement.
Related reading: Heatmaps for CRO | CRO Roadmap: 90-Day Plan | A/B Testing Cart Pages | Conversion Funnel | CRO Pillar Guide