From the conversion glossary
Concepts referenced in this article, defined.
Concepts referenced in this article, defined.
Run rigorous A/B tests and personalize every visit on Shopify or any storefront — no engineers required.
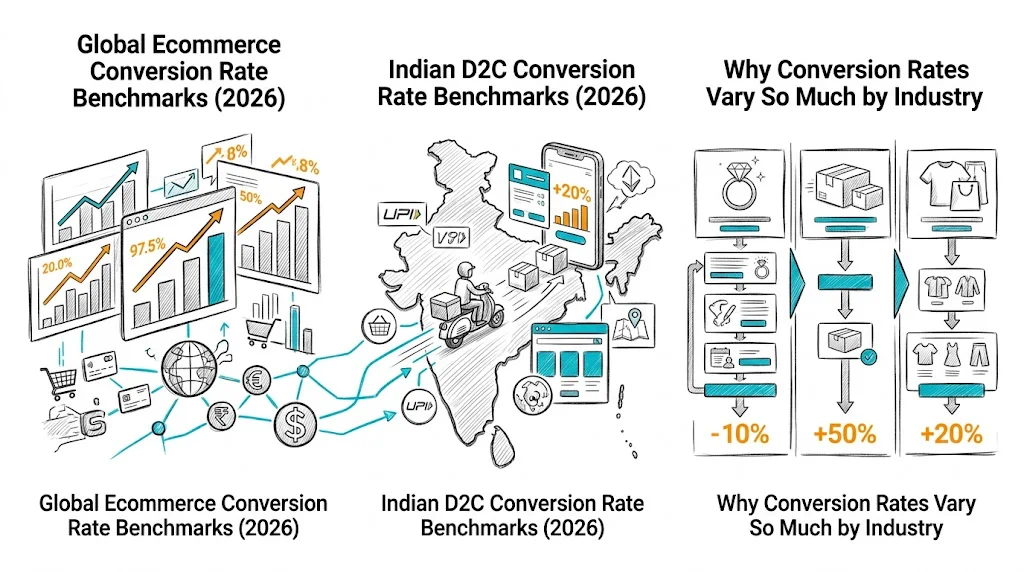
A good conversion rate for ecommerce is 2–4% globally, but what's "good" for your store depends entirely on your category, price point, traffic mix, and geographic market — a 2% CVR is excellent for a luxury jewelry brand and mediocre for a commodity consumable. This guide provides 2026 benchmarks by industry vertical, explains what drives the differences, and shows you how to interpret your own numbers against the right baseline. For Indian D2C brands, we include India-specific benchmarks which differ meaningfully from global data.
| Industry Vertical | Low | Average | Top 20% | Top 5% |
|---|---|---|---|---|
| Food & Grocery | 2.5% | 4.5% | 7% | 10%+ |
| Health & Supplements | 2% | 3.5% | 6% | 9%+ |
| Subscription Products | 3% | 5% | 8% | 12%+ |
| Beauty & Skincare | 1.5% | 3% | 5.5% | 8% |
| Home & Garden | 1.5% | 2.5% | 4.5% | 7% |
| Sports & Fitness | 1.5% | 2.5% | 4.5% | 7% |
| Fashion & Apparel | 1% | 2.2% | 4% | 6% |
| Consumer Electronics | 0.8% | 1.8% | 3.5% | 5.5% |
| Jewelry & Accessories | 0.8% | 1.5% | 3% | 5% |
| Furniture & Home Decor | 0.5% | 1.2% | 2.5% | 4% |
Source: Aggregated from Shopify analytics, industry CRO reports, and CustomFit.ai customer data.
Indian D2C benchmarks differ from global averages due to:
| Category | India Average | India Top 20% |
|---|---|---|
| Beauty & Skincare | 2–3.5% | 5–7% |
| Hair Care | 2.5–4% | 6–8% |
| Health & Ayurveda | 2–3.5% | 5–7% |
| Fashion & Apparel | 1–2.5% | 4–5.5% |
| Consumer Electronics | 0.8–1.5% | 3–4% |
| Food & Beverages | 2–4% | 6–9% |
| Baby & Kids | 2.5–4.5% | 6–8% |
| Fitness & Sports | 1.5–3% | 4.5–6% |
Indian brands on CustomFit.ai:
Low-consideration products (snacks, cosmetics, supplements under ₹500) convert at higher rates because the risk of a "wrong" purchase is low. High-consideration products (electronics, jewelry, furniture) have longer research cycles — visitors often visit 3–5 times before buying.
Implication: If you sell high-consideration products, don't compare your CVR to food/grocery benchmarks. Focus on improving returning visitor conversion rate and email nurture sequences instead.
Higher price = lower CVR for equivalent product categories. A ₹299 shampoo converts faster than a ₹2,999 hair treatment device, even on the same website with the same audience. Within your category, lower-priced products should convert at higher rates.
Implication: Bundle your data by price tier, not just category. A CVR below benchmark might actually be appropriate for your price point.
CVR is meaningless without considering where your traffic comes from:
A store driving most traffic from cold paid social will have a lower blended CVR than one with strong email and organic channels — even if they're equally well-optimized for their respective audiences.
As noted earlier, mobile CVR is typically 50–60% of desktop CVR. Stores with higher mobile traffic shares will show lower blended CVRs — but that's a traffic mix effect, not necessarily a conversion problem.
Segment your CVR by device before benchmarking. Then compare mobile-to-mobile and desktop-to-desktop.
| Traffic Source | Typical CVR Range | Notes |
|---|---|---|
| Email (existing customers) | 5–12% | Highest intent, existing relationship |
| Email (newsletter subscribers) | 2–5% | Strong interest, not yet buyers |
| Branded paid search | 4–8% | High intent, already know your brand |
| Non-branded paid search | 1.5–4% | Research intent, comparing options |
| Google Shopping | 1.5–3% | Visual + price comparison context |
| Facebook/Instagram Ads (retargeting) | 2–5% | Warm audience |
| Facebook/Instagram Ads (cold) | 0.5–1.5% | Cold audience, lower intent |
| Influencer/affiliate | 0.5–3% | Varies widely by influencer fit |
| Organic search | 2–4% | Research intent, good quality |
| Direct | 3–6% | High brand awareness, return intent |
The median Shopify store converts at approximately 1.4%. But the distribution is skewed — the top stores pull the average up.
| Shopify Store Percentile | Conversion Rate |
|---|---|
| Top 5% | 5%+ |
| Top 20% | 3%+ |
| Top 50% (median) | 1.4% |
| Bottom 50% | <1.4% |
If you're at 1.4%, there's significant headroom. CustomFit.ai's customers average an 11% relative lift from their first CRO program — on a 1.4% baseline, that's moving to ~1.55%, which sounds small but represents a 10% revenue increase with no additional ad spend.
The biggest driver of sub-1% CVR is lack of trust — visitors don't believe the product will work or worry about the purchase experience. Trust improvements:
Every 1 second of additional load time reduces CVR by approximately 7%. On mobile, this effect is even stronger. Indian D2C stores often lose significant CVR from slow image loading on 4G connections.
With 75–85% of Indian D2C traffic on mobile, a poor mobile experience directly explains most conversion rate gaps. Test mobile product page layout, sticky CTAs, and simplified checkout.
Brands that run continuous A/B testing programs consistently achieve above-benchmark CVRs. The improvement compounds — each test builds on previous wins. CustomFit.ai customers average 11% CVR lift; Bellavita reached 11%, Kapiva 9.48% through systematic testing programs.
Unclear pricing, hidden shipping fees, and confusing discount presentation all suppress CVR. Test: showing shipping cost upfront, MRP vs. discounted price display, and free shipping threshold messaging.
Don't just aim for "average" — use benchmarks to set directional goals:
Step 1: Find your current blended CVR (last 90 days)
Step 2: Segment by device and traffic source
Step 3: Compare each segment to the appropriate benchmark
Step 4: Identify your biggest gap (e.g., mobile CVR is 40% below your category's mobile benchmark)
Step 5: Form 3–5 hypotheses to close the gap
Step 6: Run A/B tests to validate hypotheses
Step 7: Set a quarterly CVR target based on benchmark and test roadmap
Example target-setting:
To understand the revenue impact of CVR improvements:
Revenue Increase = Monthly Traffic × (New CVR - Current CVR) × AOV

Example:
- Monthly traffic: 50,000
- Current CVR: 2%
- New CVR (after optimization): 2.4%
- AOV: ₹699
- Revenue increase = 50,000 × (0.024 - 0.02) × 699 = ₹1,39,800/month
A 0.4% absolute CVR improvement (20% relative) on 50,000 monthly visitors at ₹699 AOV = ₹1.4L additional monthly revenue — without increasing ad spend.