From the conversion glossary
Concepts referenced in this article, defined.
Concepts referenced in this article, defined.
 cro
croPre-order waitlist CRO strategies that convert hype into real revenue - how to design waitlist and pre-order pages that don't lose momentum before launch.
 cro
croFirst purchase experience optimization - practical strategies to turn first-time visitors into buyers, from welcome offers to a smarter new customer funnel.
 cro
croRetail media CRO explained - how to monetize on-site ads and sponsored placements without tanking your conversion rate. A practical balance guide.
Run rigorous A/B tests and personalize every visit on Shopify or any storefront — no engineers required.
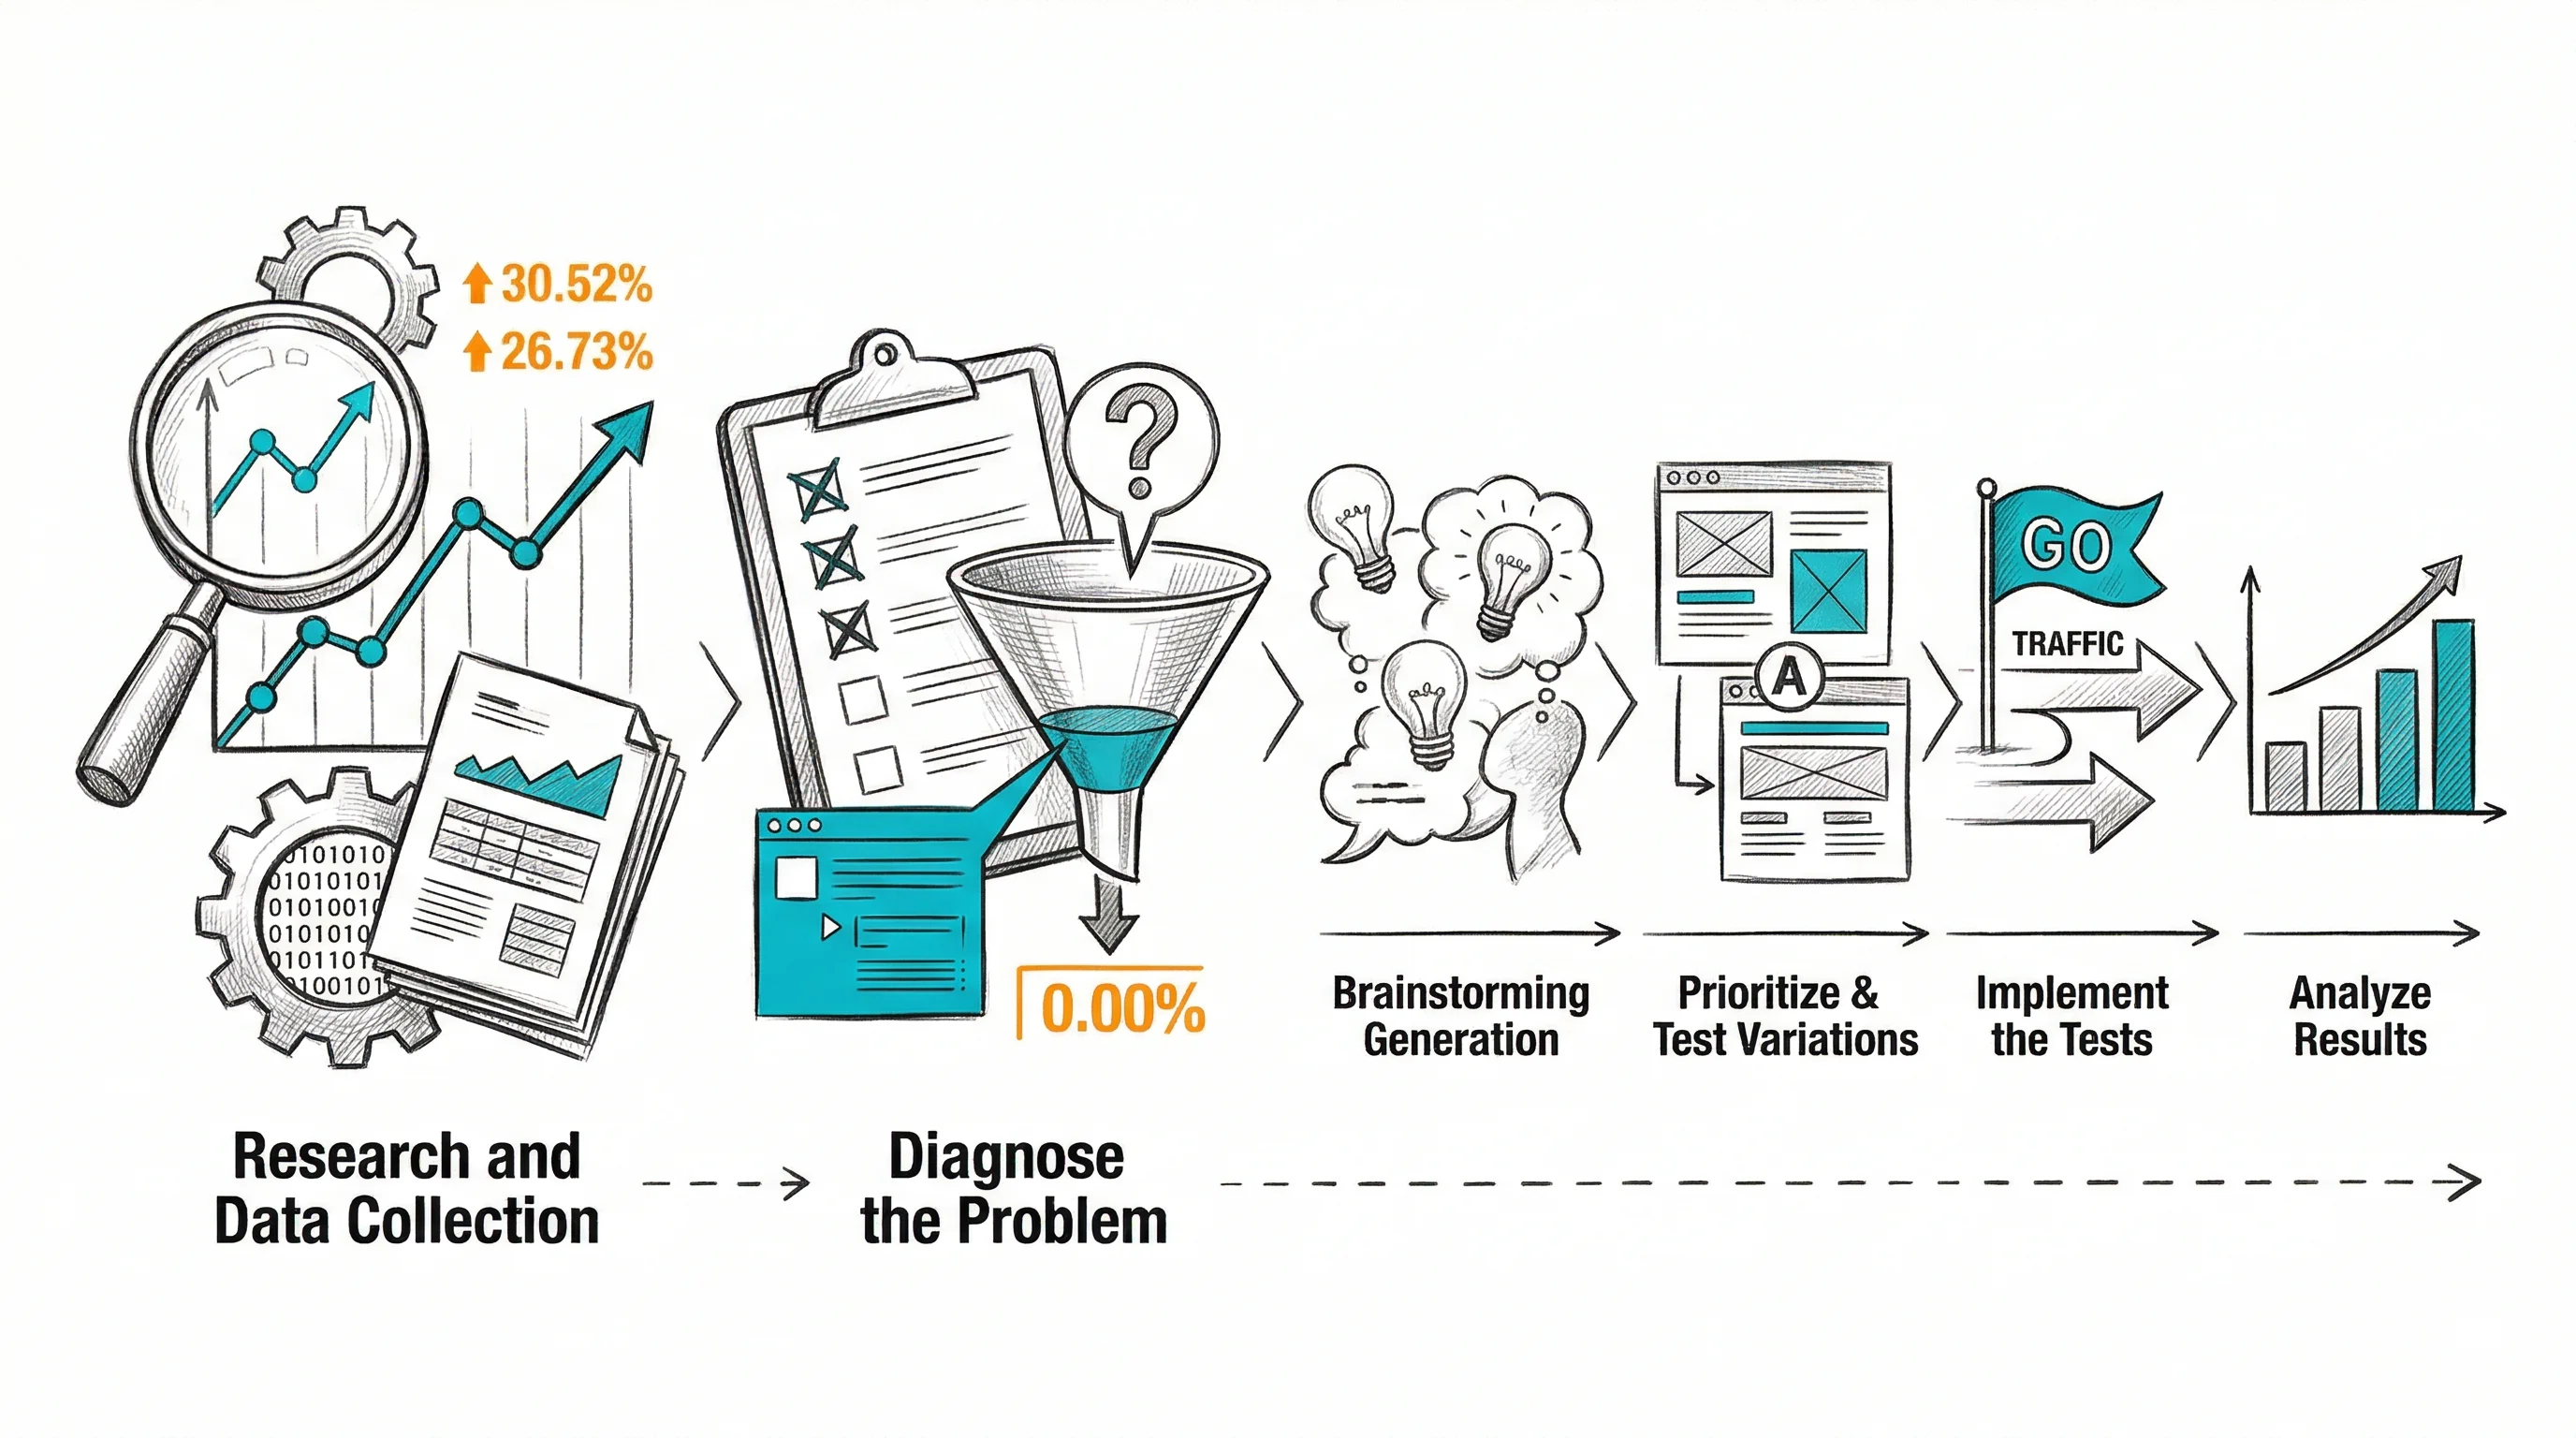
Conversion rate optimization (CRO) is not a collection of random tactics — it's a structured, repeatable process that systematically identifies what's preventing visitors from buying and then tests solutions with data. Brands that treat CRO as a process (not a project) compound improvements over time: a 5% CVR lift from Q1 + another 5% from Q2 doesn't equal 10% improvement — it equals greater compounding gains that build into substantial revenue growth. The six-step CRO process outlined here is what top D2C brands like Bellavita and Kapiva use to systematically achieve conversion rate improvements every quarter.
Research → Diagnose → Hypothesize → Test → Analyze → Iterate
This cycle runs continuously — each iteration feeds insights into the next round of research.
CRO starts with understanding your current state. Collect quantitative and qualitative data before forming any hypotheses.
Analytics audit:
Tools: Shopify Analytics, Google Analytics 4, CustomFit.ai dashboard
Heatmap and session recording:
Tools: Microsoft Clarity (free), Hotjar
Customer surveys: Ask recent buyers: "What almost stopped you from buying?" and "What made you decide to buy?" These answers often reveal the exact objections to test against.
Customer support tickets: Look for recurring pre-purchase questions ("Do you offer COD?", "What's your return policy?", "Does this suit Indian skin?"). Each frequent question is a page element that needs to answer it proactively.
On-site polls: Exit-intent surveys: "You seem to be leaving — is there anything stopping you from ordering today?"
With data collected, identify where in the funnel you're losing visitors and why.
Map your funnel and identify the step with the largest percentage drop:
| Funnel Stage | Sessions | Drop-off |
|---|---|---|
| Homepage visits | 10,000 | — |
| Product page views | 6,500 | 35% |
| Add to cart | 700 | 89% |
| Checkout start | 500 | 29% |
| Purchase | 280 | 44% |
In this example: the biggest opportunity is product page → add-to-cart (89% drop-off). This is where the CRO focus should begin.
Don't stop at overall funnel data. Segment by:
Once you've found the drop-off point, categorize the likely root cause:
| Root Cause | Symptoms | Fix Direction |
|---|---|---|
| Trust deficit | High bounce on product pages, low review volume | Social proof, trust badges |
| Value unclear | High product page views, low ATC | Description, pricing clarity |
| Friction | High checkout start, low completion | Form simplification, payment options |
| Poor mobile UX | Mobile CVR << Desktop CVR | Mobile layout, CTA visibility |
| Wrong audience | High bounce from paid traffic | Ad targeting, landing page match |
A good CRO hypothesis has three parts:
Template: "If we [change X], then [metric Y] will improve by [Z%], because [reason based on data]."
Examples:
"If we add a sticky 'Add to Cart' button visible on mobile scroll, then mobile add-to-cart rate will increase by at least 8%, because 65% of our mobile sessions show users scrolling past the fold without tapping the CTA."
"If we display COD availability prominently below the product price (currently only visible at checkout), then conversion rate for Tier 2 city traffic will improve by at least 5%, because customer support tickets show that 12% of pre-purchase questions ask about COD."
"If we change the hero headline from 'Premium Ayurvedic Hair Oil' to 'Reduce Hair Fall by 40% in 8 Weeks — Clinically Tested', then homepage click-through to product pages will increase by 10%, because outcome-focused headlines consistently outperform feature-focused headlines in our product category."
Score each hypothesis on a simple framework:
| Factor | Score (1–5) |
|---|---|
| Potential impact | How many visitors does this affect? How big could the lift be? |
| Confidence | How strong is the supporting data? |
| Ease of implementation | How quickly can you create and launch the test? |
PIE Score = (Potential + Impact + Ease) ÷ 3
Run tests in descending PIE score order.
One variable at a time (usually): Unless you have very high traffic and are running proper multivariate tests, change only one element per test. This ensures you know what caused the result.
Control vs. Variant: The control is your current page (unchanged). The variant includes your proposed change. Run 50/50 split for most tests (use 80/20 for risky checkout tests).
Audience definition: Decide upfront which visitors will see the test. All visitors? Only new visitors? Only mobile? Only paid traffic?
Primary metric: Define before launching which metric determines the winner. RPV is usually best for ecommerce. ATC rate is good for product page tests.
Minimum run duration: At least 2 full weeks (to account for weekday/weekend variation), regardless of whether you reach statistical significance sooner.
CustomFit.ai simplifies the testing workflow for Shopify:
CustomFit.ai's Bayesian statistical engine monitors significance continuously — you get notified when a clear winner emerges without having to check manually.
After the test completes:
Did the variant win?
Segment the results: Even if overall results are inconclusive, segment by device, traffic source, and new vs. returning. The variant might win on mobile but lose on desktop — worth knowing.
Calculate business impact: "Variant B increased RPV by ₹12 per visitor. With 15,000 monthly visitors, this is ₹1,80,000 additional monthly revenue."
Document the learning: Record hypothesis, test details, results, and interpretation. This becomes your institutional knowledge base — preventing re-running tests that already have answers.
CRO is never done. After each test cycle:
If variant won: Roll out, then ask — what's the next biggest optimization opportunity? Can we build on this win? (e.g., sticky CTA worked on mobile → now test sticky CTA copy variants)
If result was inconclusive: Go deeper into research. Use session recordings to understand why the change didn't move the needle. Form a better hypothesis.
If control won: Update your mental model. Why did your hypothesis fail? What did you learn about your customers?
| Quarter | Tests Run | CVR Start | CVR End | Growth |
|---|---|---|---|---|
| Q1 | 5 | 2.0% | 2.3% | +15% |
| Q2 | 5 | 2.3% | 2.6% | +13% |
| Q3 | 5 | 2.6% | 2.9% | +11% |
| Q4 | 5 | 2.9% | 3.2% | +10% |
In one year, 20 tests at ~10–15% improvement each = 60% relative CVR improvement. On 50,000 monthly visitors at ₹699 AOV, this is ₹7L+ additional monthly revenue from the same traffic.
If you have limited traffic (under 5,000 monthly sessions), adjust the process: