From the conversion glossary
Concepts referenced in this article, defined.
Concepts referenced in this article, defined.
Run rigorous A/B tests and personalize every visit on Shopify or any storefront — no engineers required.
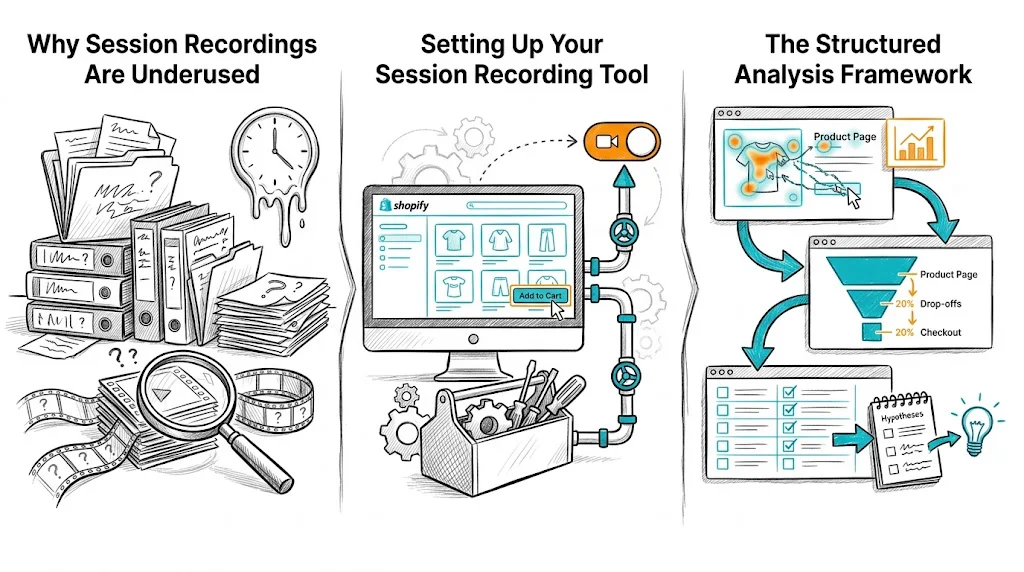
Session recording analysis means systematically reviewing recordings of real user sessions on your website to identify friction points, navigation confusion, and missed opportunities — then translating those observations into A/B testing hypotheses. Unlike quantitative analytics that tells you what is happening (bounce rate, drop-off rate), session recordings show you why it's happening. For D2C ecommerce brands on Shopify, a structured session recording review process can generate a 3-6 month testing backlog from a single afternoon of watching recordings.
Most ecommerce teams either don't watch session recordings at all, or watch them randomly without a system. Random watching produces random insights. Structured, segmented analysis produces testable hypotheses.
The difference between a wasted afternoon of watching recordings and a productive one is segmentation: you filter recordings to specific behaviors before watching. Instead of watching 100 random sessions, you watch 30 sessions of users who abandoned the checkout, or 20 sessions of mobile users who rage-clicked on your product page.
Microsoft Clarity (Free)
Hotjar (Freemium, ₹1,700-₹8,000/month)
FullStory / LogRocket
For most Indian Shopify stores, start with Microsoft Clarity. It's genuinely free, not just a freemium trial.
Configure your recording tool to capture:
Don't watch recordings chronologically. Use a behavioral segmentation approach:
Build 4-6 filtered segments before watching anything:
| Segment | Behavior Filter | What You're Looking For |
|---|---|---|
| Cart abandoners | Added to cart → did not purchase | Where in checkout did they leave? Why? |
| Rage clickers | 3+ clicks on same element | What element is confusing/broken? |
| Mobile drop-offs | Mobile + bounced in < 30 sec | First impression / page speed issues |
| Long sessions that didn't convert | Session > 5 min, no purchase | Where is the decision paralysis? |
| Product page scrollers | 80%+ scroll depth on PDP, no ATC | What is preventing add-to-cart? |
| Search users who left | Used site search, then bounced | Is search returning poor results? |
Watch 15-20 recordings per segment before drawing conclusions.
Before you start watching, create a tagging system in your recording tool. Common tags:
friction-checkout — something in checkout caused visible hesitationconfusion-navigation — user seems lost, goes back/forthrage-click — repeated frustrated clickingmobile-layout-issue — element doesn't render correctly on mobileprice-hesitation — user scrolls back to price multiple timestrust-issue — user visits return policy, shipping info, or FAQ mid-sessionform-abandon — user starts filling a form and stopsTag sessions as you watch. After 15-20 sessions in a segment, look for the most frequent tags — those are your highest-priority insights.
Every session recording insight should become a specific, testable hypothesis. The format:
"We observed [behavior] in [X out of Y] recordings. We believe this is caused by [root cause]. We hypothesize that [specific change] will [measurable outcome] by [estimated amount]."
Example:
"We observed users repeatedly tapping the size guide icon on mobile product pages in 14 of 20 recordings, but the icon doesn't expand properly on mobile. We believe this is causing uncertainty about fit. We hypothesize that making the size guide open as a full-screen modal on mobile will increase add-to-cart rate by 8-12%."
This is a testable hypothesis ready for your A/B testing backlog.
A rage click is a rapid sequence of clicks on the same element, typically indicating frustration with something that doesn't respond or isn't clickable. Common sources:
Every rage click cluster is a high-priority fix — either a UX bug or a conversion bottleneck.
Where do users stop scrolling on product pages? The answer reveals the critical fold — the point beyond which your content isn't being seen.
For Shopify D2C stores:
On checkout pages, session recordings reveal where in the form users stop:
For Indian ecommerce: watch specifically for users who reach payment and then look for a "COD" option they can't find. If it's buried, moving COD to a more prominent position in the payment selector is a testable hypothesis.
Multiple scrolls back to the price, or long pauses before the add-to-cart button, indicate:
These sessions generate hypotheses around trust badges (see A/B testing trust badges), price anchoring, and guarantee language placement.
After analyzing 100-150 recordings across your segments, you'll have a list of observed behaviors and corresponding hypotheses. Prioritize them using a simple scoring framework:
Frequency — How often did this behavior appear? (1-5 score) Impact — How close is this friction point to the conversion action? (1-5 score) Ease — How easy is this to test/fix? (1-5 score)
Total score = Frequency + Impact + Ease. Highest scores go first in your testing backlog.
Session recordings are most powerful when combined with:
Heatmaps — Aggregate click patterns across all sessions; recordings show individual behavior Funnel analysis — Quantitative drop-off rates tell you where to focus; recordings tell you why User surveys — Post-purchase surveys tell you what customers felt; recordings show what they did A/B test results — After a test runs, watch recordings of each variant to understand behavioral differences that the numbers don't explain
Related reading: CRO Pillar | CRO Budget Guide | A/B Testing Navigation Menus | Bounce Rate | Conversion Funnel